North American oil and gas firms report higher third-quarter earnings
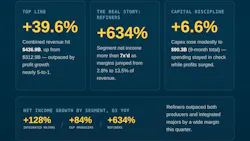
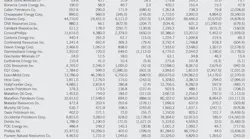
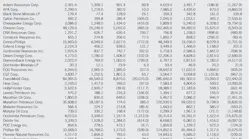
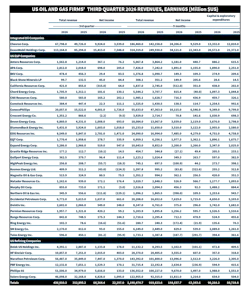
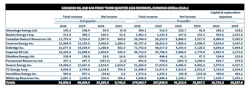
The 38 US oil and gas producers and refiners in Oil & Gas Journal's sample reported combined revenues of $436.9 billion for third-quarter 2026, compared with $312.9 billion a year earlier, and net income of $64.4 billion against $22.3 billion. Revenue increased nearly 40%, while net income nearly tripled.
For the first 9 months of 2026, the US companies generated revenues of $1,190.5 billion, up from $910.8 billion in the comparable 2025 period. Net income totaled $144.6 billion, compared with $63.3 billion, while capital and exploratory expenditures increased to $90.3 billion from $84.7 billion.
Higher crude oil prices and stronger refining margins helped lift third-quarter results amid continued disruptions to Middle Eastern energy supplies. According to the US Energy Information Administration (EIA), Brent front-month futures opened July at about $72/bbl following increased shipping through the Strait of Hormuz in June. Prices climbed after renewed military strikes in July and surpassed $100/bbl on July 23.
Another escalation in September drove Brent futures above $100/bbl, with prices peaking at about $109/bbl on Sept. 15. Brent spot prices reached about $132/bbl around the same time. The third-quarter average WTI price was around $87/bbl, compared with $65/bbl a year earlier.
US refinery utilization averaged 95% during the quarter, with crude runs reaching their highest third-quarter level since 2019. The average gasoline crack spread more than doubled from third-quarter 2025, while distillate and jet fuel crack spreads nearly tripled. US distillate inventories were 13% below their 5-year seasonal average as of Sept. 25, reflecting sustained exports and constrained global supplies.
US natural gas prices remained subdued during the third quarter despite strong summer electricity demand and higher international gas prices. Henry Hub spot prices averaged $2.87/MMbtu, down from $3.03/MMbtu a year earlier, as record domestic production and ample inventories limited price gains. US dry natural gas production averaged 115.1 bcfd during the third quarter, up 6.3% from 108.3 bcfd a year earlier. US LNG exports averaged an estimated 17.0 bcfd during the third quarter, up 16.4% from 14.6 bcfd a year earlier, although maintenance at export plants temporarily constrained shipments.
The 12 Canadian companies in OGJ's sample reported combined third-quarter revenues of $92.5 billion (Canadian dollar), up from $68.6 billion a year earlier, and net income of $15.3 billion, compared with $5.7 billion. Nine-month revenues increased to $275.0 billion from $207.9 billion, while net income reached $41.1 billion against $25.9 billion. Capital and exploration expenditures for the first 9 months totaled $31.7 billion, up from $28.3 billion.
The Western Canadian Select (WCS) discount to WTI averaged $13.86/bbl in the third quarter, compared with $10.36/bbl a year earlier, according to Canadian Natural Resources. The company attributed the wider differential primarily to stronger WTI prices and increased heavy crude availability on the US Gulf Coast, partly offset by tighter sour crude supplies resulting from Middle East disruptions.
US oil and gas producers
ExxonMobil Holdings Corp. reported revenues of $113.2 billion for third-quarter 2026, compared with $85.3 billion a year earlier, and net income of $15.4 billion against $7.5 billion. Worldwide upstream production averaged 4.50 MMboe/d, compared with 4.51 MMboe/d in the second quarter.
Cumulative production reached 1 billion bbl at both Guyana and Kearl, while PNG LNG passed 100 million tonnes. ExxonMobil assumed operatorship of Papua LNG and reached agreements to increase its interests in LNG projects in Papua New Guinea and Mozambique. Operating cash flow totaled $25.7 billion, while free cash flow reached $19.1 billion. ExxonMobil returned $9.4 billion to shareholders, comprising $4.3 billion in dividends and $5.1 billion in share repurchases, and declared a fourth-quarter dividend of $1.07/share.
Chevron Corp. posted revenues of $67.8 billion for the third quarter, up from $49.7 billion in third-quarter 2025, and earnings of $9.9 billion compared with $3.5 billion. Worldwide net oil-equivalent production averaged 3.98 MMboe/d, down from 4.09 MMboe/d a year earlier. US output topped 2 MMboe/d for a fifth straight quarter. US refinery crude throughput reached a record 1.09 million b/d, with crude unit utilization approaching 98%. Operating cash flow was $16.0 billion, with free cash flow of $12.0 billion. Total debt decreased by $3.5 billion during the quarter, and the company announced agreements to lower Bakken midstream costs by about 50%.
ConocoPhillips recorded revenues of $20.1 billion for third-quarter 2026, against $15.5 billion a year ago, with earnings of $4.0 billion compared with $1.7 billion. Total production averaged 2.30 MMboe/d, including 1.52 MMboe/d from the Lower 48. Delaware basin production contributed 757,000 boe/d, while the Eagle Ford produced 369,000 boe/d. The company's realized price averaged $61.40/boe, up 32% from $46.44/boe a year earlier. ConocoPhillips generated $7.2 billion in operating cash flow and funded $3.1 billion of capital expenditures and investments. It distributed $3.4 billion to shareholders and raised its quarterly ordinary dividend 11% to $0.93/share. At Willow, module fabrication was more than 75% complete, with first oil targeted for early 2029.
Occidental Petroleum Corp. reported revenues and other income of $6.8 billion for third-quarter 2026, compared with $5.6 billion in third-quarter 2025, and net income attributable to common stockholders of $1.6 billion against $661 million. Global production averaged 1.43 MMboe/d, exceeding the midpoint of guidance. Higher output from the Permian and Rockies helped offset temporary curtailments at certain Gulf of Mexico infrastructure caused by pipeline constraints and maintenance. Operating cash flow from continuing operations totaled $4.1 billion. Occidental generated $2.8 billion of free cash flow before working capital from continuing operations, with capital expenditures of $1.3 billion. The company reduced principal debt by $1.8 billion during the quarter, reaching its $10.0 billion debt milestone.
EOG Resources Inc. reported revenues of $8.5 billion for the third quarter, compared with $5.8 billion a year earlier, and net income of $2.8 billion against $1.5 billion. Quarterly crude oil, NGL, and natural gas production reached records, with each exceeding the midpoint of guidance. Cash provided by operating activities totaled $3.8 billion, and free cash flow reached $2.2 billion. EOG paid $544 million in regular dividends and repurchased $1.0 billion of shares. EOG also approved an expansion of its Janus gas processing plant in the Delaware basin. It also signed a long-term natural gas sales agreement linked to Japan-Korea Marker pricing and increased its regular quarterly dividend 8% to $1.10/share.
Devon Energy Corp. posted revenues of $6.9 billion for third-quarter 2026, up from $4.3 billion a year earlier, with net earnings of $1.0 billion compared with $693 million. Production averaged 1.67 MMboe/d in the first full quarter of combined operations following the Coterra merger, including oil output of 553,000 b/d. The company also announced an agreement to sell its Eagle Ford assets for $4.2 billion and increased its expected yearend 2026 annualized merger-synergy run rate to about $350 million.
Diamondback Energy Inc. generated revenues of $5.4 billion for third-quarter 2026, compared with $3.9 billion a year earlier, while net income increased to $1.6 billion from $1.0 billion. Average oil production reached 525,000 b/d, with total production of 1.03 MMboe/d. Operating cash flow totaled $2.6 billion, and cash capital expenditures were about $1.0 billion. Free cash flow reached $2.1 billion, and Diamondback repurchased 1.3 million common shares for about $251 million. The company increased its annual base dividend 7.3% to $4.72/share and acquired a 7.5% equity interest in the Solitude Pipeline System, connecting Permian natural gas supplies to the Katy, Tex., market area. Full-year oil production guidance was raised to about 524,000 b/d.
US independent refiners
Marathon Petroleum Corp. reported third-quarter revenues of $56.5 billion, compared with $35.8 billion a year earlier, and net income attributable to the company of $7.4 billion against $1.4 billion. Refining and Marketing adjusted EBITDA totaled $9.9 billion, compared with $1.8 billion for third-quarter 2025. The segment's refining margin reached $45.70/bbl, up from $17.60/bbl a year earlier. Crude capacity utilization was 100%, with total throughput averaging 3.2 million b/d. Marathon returned $3.3 billion to shareholders and announced a 10% increase in its quarterly dividend. Marathon also agreed to sell its St. Paul Park and Mandan refineries and associated midstream assets for $4.2 billion, with proceeds intended primarily for Gulf Coast investment.
Valero Energy Corp. recorded revenues of $46.1 billion for third-quarter 2026, against $32.2 billion in the year-ago period, and net income of $6.8 billion compared with $1.1 billion. Refining segment operating income increased to $8.8 billion from $1.6 billion, with throughput averaging 3.0 million b/d. The Renewable Diesel segment recorded operating income of $353 million, compared with a $28 million loss a year earlier, on sales averaging 3.4 million gal/day. Ethanol segment operating income was $272 million, with record production averaging 4.8 million gal/day. Valero completed the St. Charles fluid catalytic cracking unit optimization project during the quarter, increasing its capacity to produce alkylate and gasoline. Valero also repaid $526 million of maturing debentures and senior notes.
Phillips 66 reported third-quarter revenues of $51.5 billion, compared with $35.0 billion a year earlier, and earnings of $5.6 billion against $133 million. Refining crude capacity utilization averaged 98%, with record Central Corridor processed inputs of 848,000 b/d. Realized refining margins increased to $38.00/bbl from $24.08/bbl in the second quarter. Distillate yield reached a third-quarter record 41%, while clean product yield was 86%. Midstream NGL fractionation volumes averaged about 1.0 million b/d, with wellhead processing volumes of 4.6 bcfd. Shareholder returns totaled $2.8 billion through dividends and repurchases, while total debt declined $2.0 billion to $18.5 billion.
HF Sinclair Corp. posted revenues of $10.9 billion for third-quarter 2026, compared with $7.3 billion a year earlier, and net income of $2.0 billion against $403 million. Refining segment income before interest and income taxes increased to $2.4 billion from $476 million. Adjusted refinery gross margin reached $54.22/bbl of produced products sold, compared with $19.16/bbl a year earlier. Refinery crude charge averaged 614,060 b/d, down from 639,050 b/d, partly reflecting a planned turnaround at El Dorado. HF Sinclair returned $572 million to stockholders through dividends and share repurchases. HF Sinclair declared a quarterly dividend of $0.525/share and continued preparations to separate its Lubricants & Specialties business.
PBF Energy Inc. reported third-quarter revenues of $12.1 billion, up from $7.7 billion a year earlier, and net income attributable to the company of $1.5 billion compared with $170 million. Income from operations increased to $2.1 billion from $286 million for third-quarter 2025. PBF reduced net debt by more than $1.2 billion during the quarter and ended September with $2.5 billion in cash and $2.1 billion of total debt. Its Martinez refinery, which returned to full operation in May, continued operating following restoration work related to the 2025 fire. PBF increased its quarterly dividend 18% to $0.325/share. The company's Refinery Business Improvement program is expected to deliver more than $350 million in annualized run-rate cost improvements by yearend 2026.
Canadian firms
All financial figures are presented in Canadian dollars unless noted otherwise.
Canadian Natural Resources Ltd. reported revenues of $12.8 billion for third-quarter 2026, compared with $9.5 billion a year earlier, and net income of $3.0 billion against $600 million. Total production averaged 1.65 MMboe/d, including liquids production of about 1.22 million b/d and natural gas production of 2.6 bcfd. Thermal in situ production reached a quarterly record of 300,000 b/d, up 25,000 b/d year over year. North American conventional liquids production, excluding thermal operations, reached 358,000 b/d. A planned turnaround at Horizon reduced third-quarter volumes. The work was completed after quarterend in 28 days, 7 days ahead of budget. Net debt declined to $12.1 billion at Sept. 30, and the company declared a quarterly dividend of $0.625/share.
Suncor Energy Inc. posted revenues of $19.1 billion for third-quarter 2026, up from $12.7 billion in the same period of 2025, while net earnings increased to $3.8 billion from $1.6 billion. Upstream production averaged 852,500 b/d, compared with 870,000 b/d a year earlier. Oil sands production totaled 788,500 b/d. Refinery crude throughput averaged 487,700 b/d, representing 95% utilization, while refined product sales reached a third-quarter record of 676,900 b/d. Suncor generated $5.2 billion of free funds flow and returned more than $2.0 billion to shareholders through dividends and share repurchases. Following the quarter, the company increased its quarterly dividend 10% to $0.66/share and raised its monthly share repurchase pace to $750 million.
Cenovus Energy Inc. reported third-quarter revenues of $16.0 billion, compared with $13.2 billion a year earlier, and net earnings of $3.4 billion against $1.3 billion. Upstream production reached a quarterly record of 1.02 MMboe/d, including record oil sands production of 833,000 boe/d. Oil sands operating costs averaged $10.23/bbl, down more than $0.50/bbl from the second quarter. Downstream crude throughput averaged 437,000 b/d, with crude unit utilization of 92%, including a planned turnaround at the Lima refinery. Cenovus generated $5.0 billion in adjusted funds flow and $3.6 billion in free funds flow. Cenovus returned $1.9 billion to shareholders. In October, it agreed to acquire Athabasca Oil Corp., with closing expected in December 2026.
Imperial Oil Ltd. recorded revenues of $16.3 billion for third-quarter 2026, up from $12.0 billion a year earlier, and net income of $2.5 billion compared with $539 million. Upstream production averaged 418,000 gross boe/d, against 462,000 gross boe/d in third-quarter 2025. Kearl gross production averaged 282,000 b/d, including 200,000 b/d attributable to Imperial, while Cold Lake produced 139,000 b/d. Refinery throughput averaged 381,000 b/d, resulting in 88% capacity utilization, compared with 425,000 b/d and 98% a year earlier. Results reflected planned maintenance and third-party pipeline disruptions. Imperial generated $3.2 billion in operating cash flow and returned $2.5 billion to shareholders through dividends and repurchases.
Enbridge Inc. reported revenues of $21.1 billion for third-quarter 2026, compared with $14.6 billion a year earlier, and earnings attributable to common shareholders of $1.3 billion against $682 million. Adjusted EBITDA increased to $4.4 billion from $4.3 billion, while distributable cash flow reached $2.7 billion. The Aspen Point expansion of the BC Pipeline and the Tennessee Ridgeline gas transmission project entered service during the quarter. Enbridge announced the acquisition of Tallgrass Energy's crude oil business and completed the acquisition of Salt Creek Midstream's crude gathering assets in October. Its secured growth backlog stood at about $38 billion. The company reaffirmed full-year 2026 adjusted EBITDA guidance of $20.2-20.8 billion.
TC Energy Corp. posted third-quarter revenues of $4.0 billion, up from $3.7 billion a year earlier, while consolidated net income increased to $1.2 billion from $764 million. Canadian natural gas pipeline deliveries averaged 24.3 bcfd, up 6% year over year, while US natural gas pipeline flows averaged 27.0 bcfd, up 3%. Mexico natural gas pipeline flows averaged 3.7 bcfd, an increase of 8%. Bruce Power achieved quarterly availability of 96.6%. To serve growing US Midwest power demand, TC Energy approved gas transmission expansions including the Crossroads and American Midwest projects.
About the Author
 Conglin Xu
Managing Editor-Economics
Conglin Xu, Managing Editor-Economics, covers worldwide oil and gas market developments and macroeconomic factors, conducts analytical economic and financial research, generates estimates and forecasts, and compiles production and reserves statistics for Oil & Gas Journal. She joined OGJ in 2012 as Senior Economics Editor.
Xu holds a PhD in International Economics from the University of California at Santa Cruz. She was a Short-term Consultant at the World Bank and Summer Intern at the International Monetary Fund.
 Laura Bell-Hammer
Statistics Editor
Laura Bell-Hammer is the Statistics Editor for Oil & Gas Journal, where she has led the publication’s global data coverage and analytical reporting for more than three decades. She previously served as OGJ’s Survey Editor and had contributed to Oil & Gas Financial Journal before publication ceased in 2017. Before joining OGJ, she developed her industry foundation at Vintage Petroleum in Tulsa. Laura is a graduate of Oklahoma State University with a Bachelor of Science in Business Administration.