US firms post sharp earnings gains in second-quarter 2026

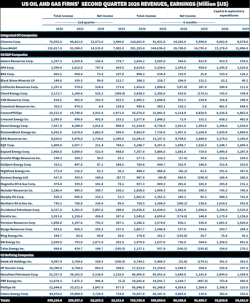
The 38 US producers and refiners in OGJ's sample reported combined second-quarter revenues of $439.1 billion, up from $299.3 billion a year earlier, and net income of $62.2 billion against $22.3 billion. Six-month revenues totaled $752.7 billion versus $598.1 billion, with net income of $80.5 billion compared with $41.5 billion, on first-half capital and exploratory expenditures of $59.8 billion against $54.3 billion.
US oil and gas producers' and refiners' second-quarter 2026 results were shaped by continued disruption to crude oil and product flows through the Strait of Hormuz, which lifted crude prices for most of the quarter and drove US refining margins, runs, and exports higher.
In second-quarter 2026, Brent futures averaged $97.05/bbl, up from $77.80/bbl in the first quarter and $66.96/bbl in second-quarter 2025. During the same period, the average price of WTI crude oil was $92.85/bbl, compared with $72.17/bbl in the first quarter and $63.71/bbl in the same period of the previous year.
Brent crude endured a volatile second quarter, swinging from a high of $118/bbl on Apr. 29 to a low of $72/bbl on June 26. The quarter opened with prices already above $100/bbl, as disruptions to flows through the Strait of Hormuz cut off crude access for much of the world and pushed several Middle East producers to shut in output. That uncertainty over whether the strait would reopen kept markets on edge through April and May, with Brent swinging by an average of $4/bbl a day—four times the swing seen in the same months of 2025.
Negotiated ceasefires and growing anticipation of resumed shipping drove prices lower from May 18 to June 17, and the trend held after the US and Iran signed a memorandum of understanding (MOU) on June 17 aimed at restoring traffic through the strait—sending Brent generally lower for the rest of the quarter. However, that calm proved short-lived. By August 2026, the MOU had unraveled, attacks on tankers resumed, and Brent climbed back into the high-$80s and low-$90s as a fresh standoff over access to Hormuz reignited supply fears.
The US Energy Information Administration (EIA)'s July Short-Term Energy Outlook (STEO) estimated second-quarter global crude inventory declines averaging 5.1 million b/d, while US commercial crude stocks moved from above the seasonal 5-year average at the start of the quarter to their lowest seasonal level since 2014 at the end, driven by record crude exports and high refinery runs. Second-quarter US crude production held near record highs around 13.9 million b/d.
US refineries processed the most crude for the second quarter since 2019, when refining capacity was 4% higher. The quarterly average gasoline crack spread rose 60% year over year (y-o-y), and distillate and jet fuel cracks more than doubled. EIA estimated distillate exports averaged 1.56 million b/d, 30% above the 5-year average, and jet fuel exports 356,000 b/d, more than double.
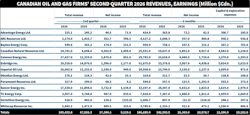
The 13 Canadian companies in the sample posted combined revenues of $105.4 billion, up from $67.0 billion, and net income of $17.4 billion versus $9.1 billion. Six-month revenues were $186.7 billion against $142.3 billion, with net income of $26.4 billion compared with $20.6 billion and first-half capital and exploration spending of $21.5 billion, up from $19.3 billion.
WCS's differential to WTI fluctuated widely during the quarter, widening to roughly $17.00/bbl in mid-April, then narrowing to $11.15/bbl by mid-June. The differential averaged $14.62/bbl for the quarter, against $14.12/bbl in the first quarter and $10.19/bbl a year earlier.
US oil and gas producers
ExxonMobil Corp. reported revenues and other income of $116.0 billion, against $81.5 billion a year earlier, with earnings of $14.5 billion compared with $7.1 billion.
ExxonMobil’s upstream earnings improved on record Permian basin production of more than 1.8 MMboe/d, consistent with a planned 9% compound annual growth rate through 2030, and the absence of the Kazakhstan disruptions seen in the first quarter. Companywide production averaged 4.51 MMboe/d, down from 4.59 MMboe/d in the first quarter, due to the loss from the Middle East conflict. The fifth Guyana floating production, storage, and offloading (FPSO) vessel set sail during the quarter, adding 250,000 b/d of capacity, with startup on plan for fourth-quarter 2026. Cash flow from operations was $23.6 billion and free cash flow $17.2 billion; distributions totaled $9.4 billion, including $4.3 billion of dividends and $5.1 billion of repurchases. First-half capital and exploratory expenditures were $13.3 billion.
Chevron Corp. posted revenues and other income of $70.1 billion for second-quarter 2026, up from $44.8 billion a year ago, and net income of $12.1 billion against $2.5 billion. The company’s US net oil-equivalent production rose 382,000 b/d from the year-ago period to a quarterly record, primarily from the Hess acquisition and growth in the Permian basin and Gulf of Mexico. International volumes rose by 292,000 b/d, and worldwide production was 4.1 MMboe/d versus 3.4 MMboe/d, 20% higher. US refinery crude unit throughput was a record 1.07 million b/d at crude unit utilization above 97%. Total debt was cut by a record $8.4 billion in the quarter, and Chevron returned $6.6 billion to shareholders, comprising $3.5 billion in dividends and $3.1 billion in repurchases. The company signed a 20-year power agreement with Microsoft for a West Texas data center.
ConocoPhillips recorded revenues of $19.5 billion, compared with $14.7 billion for the year-ago quarter, and earnings of $3.9 billion versus $2.0 billion. Production was 2.25 MMboe/d for the quarter, down 143,000 boe/d y-o-y, as Lower 48 organic growth was more than offset by the Middle East conflict's impact on Qatar and higher Surmont royalties. Lower 48 volumes were 1.48 MMboe/d, including 720,000 boe/d from the Delaware basin, 202,000 boe/d from the Midland basin, 363,000 boe/d from the Eagle Ford, and 189,000 boe/d from the Bakken. Total realized price averaged $62.33/boe, 36% higher than $45.77/boe a year earlier. The company funded $3.0 billion of capital expenditure, repurchased $2.0 billion of shares, paid $1.0 billion in dividends, and declared a third-quarter dividend of $0.84/share. First-half capital and exploratory expenditures were $6.2 billion.
Occidental Petroleum Corp. reported revenues of $8.3 billion, up from $5.3 billion a year ago, and net income of $2.8 billion compared with $288 million. Total global production averaged 1.43 MMboe/d, exceeding the high end of guidance, with contributions from the Permian and Gulf of Mexico. Capital expenditures were $1.6 billion, and free cash flow before working capital from continuing operations was $3.0 billion, the highest since third-quarter 2022. Occidental cut principal debt by $1.9 billion to $11.8 billion, advancing toward its $10.0 billion milestone, and raised the quarterly dividend 8%. Third-quarter production is guided to 1.40-1.44 MMboe/d, with full-year capital guidance maintained at $5.5-5.9 billion.
EOG Resources Inc. reported total revenues of $8.6 billion, against $5.5 billion for second-quarter 2025, and net income of $2.7 billion versus $1.3 billion a year ago. Crude oil and condensate volumes averaged 548,8000 b/d and total volumes 1.41 MMboe/d, above the guidance midpoint. EOG generated $2.8 billion of free cash flow, paid $540 million in regular dividends, and repurchased 9.6 million shares for $1,294 million at an average $135/share. The company established UAE oil production during the quarter, with two 1-mile lateral wells averaging more than 25,000 bbl of cumulative oil per well over the first 30 days.
Devon Energy Corp. posted revenues of $7.4 billion, compared with $4.3 billion a year earlier, and net earnings of $1.9 billion versus $899 million. Results include combined operations from May 7, when Devon closed its merger with Coterra Energy. Production averaged 1.36 MMboe/d, near the top of guidance, with oil output of 503,000 b/d. Devon generated $1.7 billion of adjusted free cash flow, excluding $174 million of after-tax restructuring costs, and raised the quarterly dividend 33% to $0.32/share. It funded a $2.6 billion New Mexico federal lease acquisition of 16,300 net acres with cash on hand, adding an estimated 400 Delaware basin locations with development expected to begin in 2027.
US independent refiners
Marathon Petroleum Corp. (MPC) reported revenues of $52.3 billion, up from $34.1 billion, with net income attributable to MPC of $5.1 billion versus $1.2 billion. Refining & Marketing segment adjusted EBITDA was $24.84/bbl for second-quarter 2026 against $6.79/bbl a year earlier, and R&M margin was $36.33/bbl versus $17.58/bbl, driven primarily by higher crack spreads in all regions. Crude capacity utilization was 94%, giving total throughput of 2.9 million b/d. Refining planned turnaround costs totaled $275 million against $250 million a year ago, and refining operating costs were $5.72/bbl versus $5.34/bbl. The El Paso yield improvement and Robinson product flexibility investments were placed in service during the quarter. MPC returned more than $2.8 billion to shareholders during the quarter. Meantime, MPLX raised its 2026 growth capital outlook by $500 million to $2.9 billion to accelerate Gulf Coast fractionation.
Valero Energy Corp. recorded revenues of $44.5 billion, compared with $29.9 billion a year earlier, and net income of $3.7 billion versus $714 million. The Refining segment reported operating income of $4.5 billion against $1.3 billion a year ago, on throughput averaging 3.0 million b/d. Renewable Diesel posted operating income of $717 million versus a $79 million loss for second-quarter 2025, while Ethanol operating income was $318 million against $54 million a year ago. Valero completed the cessation of refining operations at Benicia in California in April 2026, with decommissioning and redevelopment now reported in Corporate and Other. The $230 million fluid catalytic cracking unit optimization project at St. Charles is still expected to begin operations in third-quarter 2026. The company returned $2.6 billion to stockholders.
Phillips 66 reported revenues of $52.0 billion for second-quarter 2026, against $33.5 billion a year ago, and earnings of $3.8 billion compared with $877 million. Refining crude capacity utilization was 96% with a clean product yield of 86%, and realized refining margins were $24.08/bbl, up from $10.11/bbl in the first quarter. The company achieved record NGL fractionation volumes of 1.02 million b/d and record LPG export volumes. It reached full production at the 220-MMcfd Dos Picos II gas plant in the Permian basin and announced the 300-MMcfd Zeus gas plant and a 100,000-b/d NGL fractionator in Corpus Christi, Tex. Total debt was decreased by $6.6 billion to $20.6 billion, with net debt at $16.5 billion. Phillips 66 returned $887 million to shareholders, including $379 million in repurchases and $508 million in dividends, and completed planned turnarounds at Wood River and Humber.
HF Sinclair Corp. posted sales and other revenues of $10.4 billion, up from $6.8 billion a year ago, with net income of $892 million versus $208 million. Refining segment income before interest and income taxes was $877 million against $166 million for the previous year’s second quarter, principally on strong margins and volumes in the Mid-Continent and West regions. Adjusted refinery gross margin was $25.95/bbl, a 57% increase from $16.50/bbl a year ago. Crude oil charge averaged 639,680 b/d, up from 615,930 b/d. After a $30 million lower-of-cost-or-market inventory valuation charge and a $47 million impairment, the company’s renewables segment income before interest and income taxes was $30 million against a $4 million loss last year. The company returned $265 million to stockholders, raised the quarterly dividend 5% to $0.525/share, and guided third-quarter crude runs to 590,000-620,000 b/d, reflecting a planned El Dorado turnaround beginning in September.
HF Sinclair announced it will pursue a separation of its Lubricants & Specialties segment into an independent public company over the next 12 to 18 months, and plans to retire its Mississauga base oil assets during 2027.
Canadian firms
All financial figures are presented in Canadian dollars unless noted otherwise.
Canadian Natural Resources Ltd. reported revenues of $14.7 billion for second-quarter 2026, up from $8.7 billion a year ago, with net income of $4.5 billion compared with $2.5 billion. Record total quarterly production was approximately 1.68 MMboe/d, up 256,000 boe/d or 18% from second-quarter 2025, including record liquids production of about 1.25 million b/d, up 230,000 b/d or 23%. Record quarterly Jackfish thermal in situ production averaged about 136,000 b/d, exceeding facility nameplate capacity of 120,000 b/d. The two new steam-assisted gravity drainage pads at Pike 1 reached combined production of 46,000 b/d at a steam-to-oil ratio of 1.8. Net debt was reduced to $14.5 billion on June 30, with indirect shareholder returns of $1.6 billion. The board declared a quarterly dividend of $0.625/share in the company's 26th consecutive year of dividend increases.
Suncor Energy Inc. posted revenues of $17.5 billion for the second quarter, against $11.9 billion a year ago, and net earnings of $3.7 billion compared with $1.1 billion. Upstream production averaged 760,900 b/d, compared with 808,100 b/d a year earlier, and included a planned turnaround at Firebag. Refinery crude oil throughput rose to a second-quarter record 470,600 b/d at 92% utilization of the rerated nameplate capacity of 511,000 b/d, against 442,300 b/d and 87% for the previous year. Refinery production increased to 503,400 b/d from 464,600 b/d a year ago, and refined product sales reached a second-quarter record 654,800 b/d from 600,500 b/d, including record jet fuel sales. Suncor returned nearly $1.8 billion to shareholders, including $1.05 billion in repurchases and $706 million in dividends, and plans to raise monthly repurchases to $500 million from $350 million beginning in August 2026.
Cenovus Energy Inc. reported revenues of $17.4 billion, up from $12.3 billion, and net earnings of $2.9 billion versus $851 million. Upstream production was 970,400 boe/d, an increase of more than 200,000 boe/d from second-quarter 2025, including record quarterly oil sands production of 786,400 boe/d with records at Christina Lake and Sunrise. Downstream crude throughput was 451,500 b/d, an overall crude unit utilization rate of 95%. The company generated around $5.0 billion of adjusted funds flow and $3.8 billion of free funds flow and fully repaid and cancelled the remaining $2.2 billion on the term loan used to fund the MEG Energy Corp. acquisition, reducing net debt to $5.4 billion. Cenovus increased full-year 2026 production guidance by 25,000 boe/d and lowered oil sands operating cost guidance by about 6%, with capital investment guidance unchanged. It returned $1.4 billion to shareholders, including $1.0 billion through repurchases and $0.4 billion through dividends.
Imperial Oil Ltd. recorded revenues of $16.1 billion for 2026 second quarter, compared with $11.2 billion a year ago, and net income of $2.2 billion versus $949 million. Upstream production averaged 414,000 boe/d. Kearl total gross production averaged 257,000 b/d (182,000 b/d Imperial's share), compared with 275,000 b/d a year ago, primarily driven by the absence of exceptional high-quality ore grade, and included execution of a planned turnaround. Downstream throughput averaged 331,000 b/d for refinery capacity utilization of 76%, affected by planned turnaround work at the Strathcona refinery and unplanned downtime. Imperial lowered 2026 refinery throughput guidance to 370,000-380,000 b/d and utilization to 85-88%, from 395,000-405,000 b/d and 91-93%, and renewed its normal course issuer bid for up to 5% of outstanding common shares. Imperial Oil plans to accelerate NCIB purchases to complete the program before year-end and defer the Coker 8-2 turnaround at Syncrude to late August.
About the Author
 Conglin Xu
Conglin Xu
Managing Editor-Economics
Conglin Xu, Managing Editor-Economics, covers worldwide oil and gas market developments and macroeconomic factors, conducts analytical economic and financial research, generates estimates and forecasts, and compiles production and reserves statistics for Oil & Gas Journal. She joined OGJ in 2012 as Senior Economics Editor.
Xu holds a PhD in International Economics from the University of California at Santa Cruz. She was a Short-term Consultant at the World Bank and Summer Intern at the International Monetary Fund.
 Laura Bell-Hammer
Laura Bell-Hammer
Statistics Editor
Laura Bell-Hammer is the Statistics Editor for Oil & Gas Journal, where she has led the publication’s global data coverage and analytical reporting for more than three decades. She previously served as OGJ’s Survey Editor and had contributed to Oil & Gas Financial Journal before publication ceased in 2017. Before joining OGJ, she developed her industry foundation at Vintage Petroleum in Tulsa. Laura is a graduate of Oklahoma State University with a Bachelor of Science in Business Administration.