Resilience-based LNG piping design boosts project NPV
Key Highlights
- Resilience design involves simultaneous evaluation of wind, storm surge, wave impact, and floodwater forces, revealing combined effects that can lead to structural failure if not properly mitigated.
- A lifecycle cost analysis demonstrates that targeted resilience measures can save over $4.5 million in net present value by reducing repair, replacement, and downtime expenses over 30 years.
- Implementing resilience-based design should be integrated early in project planning, with periodic reassessment to adapt to changing hazard profiles and infrastructure conditions.
Resilience-based design of US Gulf Coast LNG piping systems is a quantitative approach to enhancing system safety, reliability, and economics for hurricane and flood loading. The full concurrent loading from the combined effects of wind, storm surge, floodwater drag, wave impact, and buoyant uplift can be evaluated by engineers to address failure modes not accounted for by code-minimum checks.
This article addresses seven failure modes in the case study of a Louisiana LNG plant: anchor-bolt pullout, pipe-saddle displacement, buried-piping buoyancy, pump-house inundation, insulation jacketing loss, vortex-induced vibration, and structural flotation or displacement. A $1.2 million estimated total of targeted enhancements directed at these failure modes resulted in an estimated $4.5 million or more in cost savings over 30 years.
The engineering evaluation supporting the article was performed during the 2019-25 detailed design and screening for resilience of an LNG plant on the Louisiana Gulf Coast. About 18 miles of piping were evaluated as part of the assessment and representative evaluations of above ground LNG piping, pipe racks, equipment foundations, pump houses, unsupported process headers, and buried piping systems were also part of the evaluation.
Analyses were based on a 165 mph, 3-sec duration hurricane wind gust; storm surge-flood elevation values of 18-25 ft above mean sea level; hydrodynamic forces acting on submerged components; buoyant forces acting on buried or low-mounted piping; and a 30-year operational time frame was assumed for the life-cycle evaluation. Project-identification data and certain geometric characteristics have been modified to ensure that all confidential data has been removed, however, the engineering results reported represent typical analysis methodology and design conditions encountered in the case study.
Background
Hurricane strength winds, storm surge, and wave impacts combined with the drag of floodwater and buoyant uplift during tropical cyclones present a compound hazard that can be underrepresented with conventional code-minimum checks for LNG plants on the US Gulf Coast. These forces affect pipe racks, cryogenic headers, pump houses, buried lines, insulation systems, and support foundations. A system that passes wind and flood tests may fail when both loads are applied during a major hurricane.
A significant portion of US LNG export capacity is on the Gulf Coast in the states of Louisiana and Texas, one of the most hurricane-prone industrial zones in the world. The economic costs, prolonged outages, and damage to critical energy infrastructure that happened as a result of Hurricanes Katrina, Harvey, Laura, and Ida highlight the damage such storms can cause.
LNG plants are particularly vulnerable, as large diameter insulated cryogenic pipe racks are exposed and many process areas are close to tidal waterways. Failure can result in loss of export capacity as well as cryogenic liquid, pressurized gas, and electrical equipment.
Minimum design requirements are provided by current standards such ASCE 7-22 and ASME B31.4/B31.8. The guidance provided, however, is not resilience-based design, but code-minimum design. Minimum-design checks typically evaluate prescribed load combinations and acceptance limits, while resilience-based design also evaluates low-probability, high-consequence events, interaction between hazards, and the economic effect of downtime over the operating life of the asset.
Wind loading
Wind design for hurricane-exposed LNG plants shall be based on project-adapted ASCE 7 wind maps, exposure factors, topographic effects, directionality effects, and site-specific design criteria. The wind speed design consideration for the resilience screening done in the case study was 3 sec at 165 mph.
Wind load on pipe racks is controlled not only by wind speed but also by exposed area. This is a special consideration for insulated cryogenic piping. For a pipe rack run at 300 ft, the projected area will be sufficiently large to cause the wind to become comparable to the pipe weight. This causes an increase in forces on the rack frames, anchor bolts, and lateral support reaction.
The second issue is vortex induced vibration (VIV). Long, unsupported vaporizer inlet headers may be subject to instability known as shedding due to the force of the wind that will excite the structure’s natural frequencies. Fatigue damage can also occur when shedding happens at the same frequency as a specific header, even when the static wind stress is deemed to be acceptable. Resilience-design, then, must involve dynamic screening of the wind-sensitive span.
High surf, inundation
For most LNG plants at the Gulf Coast, the controlling flood hazard is storm surge. The sea level rise from extreme coastal events ranges 18-25 ft above mean sea level, depending on location, bathymetry, storm track, local topography, and wave setup. If critical LNG equipment is only designed for base flood elevation plus a small freeboard, then pump houses, electrical gear, instrument cabinets, and low-mounted supports are susceptible to inundation.
The components of flood loading on piping and supports are hydrostatic pressure, hydrodynamic drag, wave impact, debris impact, and buoyant uplift. The hydrodynamic force which can act on a 3-in. OD insulated pipe can exceed 1,400 lbs/ft when the pipe resides in 15 ft of moving surge water, as a function of velocity, drag coefficient, submergence, and support configuration. This load is sufficient to cause pipes that are not properly supported to come off their saddles, to move anchor bolts out of stress relaxation areas, and to cause excessive movement at any nozzle or expansion loop.
Compound-hazard combinations
Hurricanes do not apply wind and flood as independent events. High wind, storm surge, wave action, and flooding may occur during the same operational window. Code-load combinations may reduce companion environmental effects for design consistency, but a resilience check should evaluate a full concurrent-load scenario for critical infrastructure.
For this project, the resilience case considered 100% of site wind demand acting concurrently with site-specific surge, wave, hydrodynamic, and uplift effects. This combined-hazard screening is the bridge between hazard characterization and failure analysis. Applying these concurrent loads to typical LNG piping configurations reveals seven distinct failure modes that conventional code-minimum checks may miss.
Failure-mode analysis
This article’s resilience assessment identified seven critical failure modes. Each failure mode has a specific physical mechanism, consequence, and practical mitigation. Treating the failure modes individually makes the design review more useful than a general statement that “flood and wind are severe.”
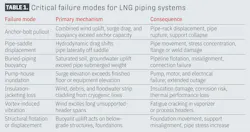
Table 1 illustrates the critical failure modes for LNG piping systems, detailing each primary mechanism—anchor bolt pullout, pipe saddle displacement, buoyant uplift, pump house inundation, insulation loss, vortex-induced vibration, and structural flotation—and their potential operational consequences.
Anchor, foundation enhancement
The anchor and foundation evaluation assessed the combined effects of hurricane winds, storm surge (hydrodynamic) drag forces, and buoyant lift on typical pipe-rack configurations, based on the representative case studies along the Louisiana Gulf Coast. The evaluations compared two separate analyses.
An independent evaluation analyzed each environmental loading mechanism separately, establishing a base line. An independent evaluation of a single environmental mechanism represents a simple worst-case scenario. The primary purpose of this type of comparison is to establish an upper bound limit for anticipated performance during normal operational conditions. In contrast, the "resilience" evaluation simultaneously applies the most limiting wind- and water-level related demand combinations. Representative pipe rack foundations designed to support large-diameter insulated piping were selected to evaluate how the combination of both environmental loadings would affect structural responses.
As previously mentioned, the independent comparison analyzed the most limiting individual environmental loading mechanisms. The maximum calculated tension developed in an anchor bolt due to each individual loading mechanism was about 42.6 kilonewton (kN)/bolt, while the maximum calculated shear in an anchor bolt due to each individual loading mechanism was about 142 kN/bolt. The maximum lateral force transferred to the foundation was about 831 kN.
As shown in Table 2 when all three loading mechanisms are simultaneously applied to the pipe rack structure, the maximum calculated tension developed in an anchor bolt increases by about 46%, to roughly 62.5 kN/bolt. Similarly, the maximum calculated shear developed in an anchor bolt due to all three loading mechanisms increases by about 40%, to 197 kN/bolt and the maximum lateral force transferred to the foundation increases by about 39%, to about 257 kN.
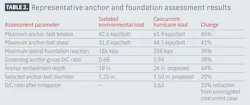
When the maximum shears and tensions are calculated using the sum-of-the-square-of-the-individual-components method, the resulting maximum shears and tensions represent the most limiting conditions encountered throughout the entire simulated event sequence. Based on these calculations, it appears that when all three loading mechanisms are simultaneously applied to the pipe rack structure, the overall capacity of the anchor system decreases by about 32%. Therefore, although total anchor demand remains less than the nominal capacity, there is sufficient decrease in capacity margins to consider the existing anchor system unsuitable for future service given multiple uncertainties including wave action, debris impacts, soil degradation, and repetitive extreme weather events.
When only one of the three loading mechanisms are applied individually to the pipe rack structure, the maximum calculated demand is less than the nominal capacity for all of the various loading mechanisms. When all three loading mechanisms are simultaneously applied to the pipe rack structure, however, there is a significant reduction in capacity margins. Specifically, as indicated above, as a result of applying all three loading mechanisms simultaneously to the pipe rack structure, the demand-to-capacity ratio for all six anchor groups exceeds unity indicating failure. Furthermore, even though the total demand remains less than the nominal capacities for some of the anchor groups after application of all three loading mechanisms, there is a significant loss of capacity margins.
As a direct result of these findings, the resilience design included deepening the embedment of selected anchors, upgrading certain anchor bolts, and adding positive lateral restraint at select pipe saddles subject to hydrodynamic displacement. For example, for the same basic foundation configuration, the embedment depth of selected anchors was increased from about 460 mm to 660 mm and four-anchor bolts were upgraded from 31.75-mm diameter to 38.10-mm diameter. Positive lateral restraints were also added at select pipe saddles subjected to greater-than-frictional hydrodynamic loads.
After implementing the described modifications, the demand-to-capacity ratio for all six anchor groups decreased from 0.94 to 0.63. As a result of increasing capacity margins, there will be a corresponding increase in confidence regarding long-term integrity of the subject LNG piping support and foundation systems.
Pump-house flood protection
The flooding scenario described will result in significant elevation of ground water. As such, it is expected that the saturated soils will be capable of exerting less frictional resistance to any upward movement of pipes than would be experienced under dry or partially saturated conditions. In addition, since the flooding event is expected to elevate ground-water levels, it is likely that many of the buried pipes will be subjected to a substantial increase in hydrostatic pressure. This, as noted previously, may further reduce the ability of the surrounding soils to resist any upward movement of pipes.
In summary, there are two primary concerns related to the potential for upward movement (buoyancy) of the buried piping:
- The likelihood that the hydrostatic forces acting on the buried piping will exceed the sum of the downward forces acting upon those same piping elements.
- The possibility that the upward force generated by the combination of hydrostatic forces and buoyancy may exceed the maximum allowable vertical deflection allowed by the designer, which is necessary to prevent excessive stress or damage to piping and its connections.
If these upward forces become greater than the sum of the downward forces and any applicable mechanical anchoring, then the vertical position of a buried pipe will shift relative to its original position. Any subsequent changes in vertical position may cause either a misalignment or excessive flexural stress due to bending. In addition, if the amount of vertical movement becomes sufficient to separate the buried piping from any adjacent surface-mounted piping and/or equipment, then a rupture may occur. A rupture can lead to costly repairs, lengthy shutdowns of the pipeline system, and additional environmental hazards.
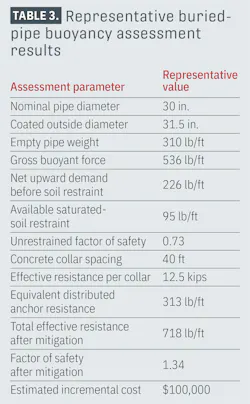
To assess whether the piping has been designed adequately to withstand these potential upward forces, a preliminary analysis used a typical 30-in. OD segment of buried piping. It was assumed that all portions of the piping were fully submerged and were subject to the hydrostatic head specified in the flood conditions table. Using a hydrostatic-force calculation method based on a rectangular cross-section and assuming that both ends of each segment were closed off completely (e.g., by valves), a gross buoyant force of roughly 536 lb/ft was determined for this particular segment. When this gross buoyant force was reduced by subtracting the submerged weight of the pipe and other permanent downward loads on the pipe, however, a net upward force of about 226 lb/ft remained before considering any restraining effect provided by the surrounding soil.
As part of the initial assessment for possible soil-restraint limitations, a conservative approach was taken regarding soil-saturation conditions. Specifically, it was assumed that the water table was close enough to the top of the trench that the entire length of the pipeline was saturated at the time of peak flooding. For purposes of evaluating soil-restraint limitations, it was assumed that saturated soil density equaled about 70% of that obtained for unsaturated (dry) soil. Under these conditions, although the soil cover remains in place overtopping the buried pipe, it provides significantly less resisting friction due to a corresponding reduction in submerged-soil unit weight. Utilizing these representative values for burial depth and saturated soil properties in conjunction with an analytical model for estimating long-term vertical soil restraint, it was concluded that a limited amount of vertical restraint (about 95 lb/ft) would be available for limiting upward movement of a buried pipe.
Based on this evaluation alone, it appeared that there existed some degree of flotation risk as indicated by a calculated factor-of-safety value of 0.73 for preventing floatation. To alleviate this identified flotation risk through implementation of structural reinforcement of the existing piping system, each vulnerable section of buried pipe would receive multiple concrete collar assemblies spaced at roughly 40-ft intervals. Each concrete collar assembly would provide a minimum effective downward resistance of about 12.5 kilopounds (kip) after accounting for concrete buoyancy and appropriate load factors.
The added downward resistance provided by each concrete collar assembly would correspondingly increase the equivalent downward resisting force to roughly 312 lb/ft. Therefore, once all required concrete collar assemblies are installed to each section of vulnerable buried piping, the overall effective resisting force against vertical displacement would increase to about 718 lb/ft versus a governing upward force of approximately 536 lb/ft. Correspondingly, this increased resisting force results in a calculated factor-of-safety value against flotation of 1.34 for the anchored condition versus approximately 0.73 for the unrestrained condition (Table 3).
As part of evaluating the adequacy of existing soil-restraint capabilities during extreme storm-surge and flood events, various assumptions were made regarding soil behavior. These included assumptions that soil properties would remain relatively consistent even though they were saturated and exposed to elevated groundwater tables. Additionally, it was assumed that no enhanced soil-strength response could occur due to temporary drainage resulting from prolonged inundation conditions. These assumptions were made to account for potentially degraded soil-restraint capacities during prolonged periods of storm-surge-induced inundation.
Although estimates varied depending on specific details regarding individual project sites, the incremental costs associated with implementing concrete-collar-anchored pipe stabilization was estimated at between $50,000 and $200,000. The justification for undertaking these measures lies in their effectiveness for reducing risks at critical points in low-lying pipeline corridors and areas prone to prolonged inundation, or transition points where buried pipelines connect to above-grade piping and equipment. By mitigating the potential for longitudinal pipe deformations and excessive bending stresses in these areas, pipeline owners and operators can minimize future post-hurricane inspection and repair requirements as well as the potential economic losses created by pipeline ruptures or damage.
VIV mitigation
Dynamic review is required when wind-exposed portions of the vaporizer inlet headers and LNG inlet process headers are long enough that lock-in begins to occur. In addition, with regard to span reductions, selected unsupported spans were reduced from 40 ft to 24 ft, and where unsupported span reduction was unsuitable, damping was added. The aim was to move the natural frequencies as far away from the excitation region as possible, minimizing fatigue demand.
The cost estimate for VIV mitigation was $350,000, with the anticipated benefit of reduced fatigue risk, reduction of inspection issues during major storms, and increased reliability of the critical vaporizer piping.
Buried-pipe buoyancy control
Pipes that are laid completely or partly in saturated coastal soils may float during a flood. When the rising force is greater than the weight of the pipe in the water and the pull from the soil, the line may be pulled up, off-center or cause damage to the attached aboveground pipe. The new resiliency design included concrete collar anchors at specific intervals, with soil restraint assumptions for flood conditions confirmed. Buried-pipe buoyancy control would cost an additional $100,000.
Insulation, cladding upgrade
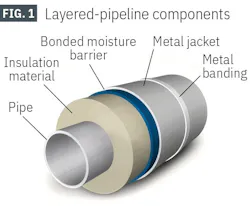
Insulation damage can lead to operational reliability issues in a cryogenic system. Aluminum jacketing can be removed by wind-driven rain, wave splash, flood water, and debris. Applying the resilience design, exposed surfaces jacketed with aluminum were upgraded to stainless steel jacketing and enhanced with better banding and fastening at an estimated incremental cost of about $150,000. Desired improvements would be reduced insulation replacement cost, reduced exposure of corrosion under the insulation, and quicker restart after storm.
Fig. 1 illustrates the layered construction of insulated piping, showing the internal pipe, insulation material, bonded moisture barrier, metal jacket, and external metal banding.
Lifecycle cost analysis
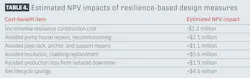
A 30-year lifecycle cost analysis was made under conditions of uncertainty. The case-study model calculated net present value at a 7% discount rate. Exceedance probability was considered for each failure mode, repair and replacement cost, downtime cost, and incremental construction cost.
Table 4 shows the estimated net present value (NPV) impacts of resilience-based design measures, showing incremental construction costs, avoided repairs for pump houses, pipe racks, insulation replacement, reduced production loss, and an overall net lifecycle savings of $4.5 million.
Implementation strategy
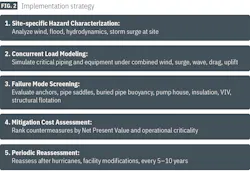
Incorporating resilience-based design elements should occur at the onset of the project and not be tackled after support details have been collected. The first step involves site-specific hazards characterization based on the project wind report, the flood study, hydrodynamic model, and the storm surge elevation basis. The second step involves making a model of critical piping and equipment for concurrent loads, taking into account the effects of full wind and surge, wave, drag, hydrostatic and uplift conditions, when the consequence of failure is high.
The third step is failure mode screening. Anchor pull-out, pipe-saddle displacement, buried-pipe buoyancy, pumphouse inundation, insulation loss, VIV, and structure floatation or displacement should all be measured by engineers. Additional site-specific hazards, like debris impact, ground liquefaction, scour or flooding of access roads, should be included in the screening matrix.
The fourth mitigation step involves the cost of mitigation. All counter measures should be related to a failure mode, probability reduction, and avoided consequence. All pump-house elevation, anchor upgrade, pipe-saddle restraint, VIV span change, buried-pipe anchor, and cladding upgrade projects should be ranked by NPV and operational criticality.
The final step is periodic reassessment. Over the lifetime of the plant, frequency of hurricanes, storm intensity, flood mapping, coastal erosion, plant growth and expansion, and matrix operating conditions can vary. Existing LNG plants should be reevaluated in the wake of significant hurricanes, following facility changes, and periodically (e.g. every 5-10 years).
Fig. 2 lays out the resilience-based design implementation strategy for LNG plants. Each horizontal bar represents a step, numbered and annotated with detailed descriptions.
Design balance, limitations
Resilience-based design shall be applied using a site-specific risk matrix. For assets in lower-risk areas or with short operating lives, incremental costs of some possible improvements may not be recovered. Designs in excess of code minimums also may need further explanation to insurance companies and building or regulatory officials.
Where the benefit is measurable, targeted steps should be taken for which the likelihood of success is high and the probability of failure and losses can be measured. For this particular case, the three best cost-benefit solutions with the greatest return on lifecycle value were pump house elevation, anchor upgrades, and VIV mitigation.
The author
Amishkumar B. Patel is a pipeline engineering resource leader at Hargrove Engineers + Constructors. He is a licensed professional engineer (PE), project management professional (PMP), researcher, inventor, and engineering leader and has more than 12 year’s experience in energy, infrastructure, manufacturing, and emerging technologies working for companies such as CB&I, Tesla, and ISAT. Patel earned a bachelor's degree in mechanical engineering from Gujurat Technological University and a master’s degree in mechanical engineering from Lamar University in Beaumont, Tex.