Capital deployment in oil and gas: Are you reinvesting enough?

Gregory V. Milano, John R. Cryan, and Jeff Routh
Fortuna Advisors LLC, New York, NY
Given the high asset intensity and inherent risks in the oil and gas industry, capital deployment choices are perhaps the most impactful strategic decisions made by senior executives and directors. How much of the cash flow generated should be reinvested in such areas as exploration, production, R&D, capital expenditures, and acquisitions? How much should be distributed via dividends and share repurchases? For each company, the answers will undoubtedly shape the growth and return patterns of the business and will drive share price performance for years to come.
We all know the risk of overinvesting: low-yielding projects drag down future performance and may end in write-offs or impairments. However, there is a less apparent risk in investing too little as well – future growth may stall. A close parallel to "under" investing is paying out too much in the form of dividends and share repurchases which risks sapping the capital and strength needed to make key opportunistic investments when they arise. Distributing too little may be a magnet for activist investors that campaign against the building of excess cash balances and unlevered financial slack. Each decision and trade-off requires a systematic approach to balance the risk and reward of these capital allocation choices in a way that closely aligns with how shareholders value each option.
At Fortuna Advisors, we developed the "reinvestment rate," a useful measure for considering capital deployment strategies. The reinvestment rate quantifies the percentage of cash flow that is reinvested back into the business and can be a good way to gauge likely future growth trends. To calculate it, add capital expenditures, acquisitions, R&D, and other investments. Next, divide that sum by a consistent measure of cash flow defined as earnings before interest, taxes, depreciation, and amortization (EBITDA), plus R&D and rent, less taxes.
The companion measure is the "distribution rate," which indicates the proportion of cash flow that is distributed to shareholders in the form of dividends and share repurchases. While generally, high reinvestment rate companies have lower distribution rates, the relationship varies on a case by case basis as cash flow is also influenced by borrowing, debt repayments, and changes in cash balances.
What are investors really looking for? The anthropologist Margaret Mead once said, "What people say, what people do, and what they say they do are entirely different things." Putting this in the context of capital deployment, we believe it is better to go by what investors do than what they say.
To help executives better understand what investors "do," as input to considering corporate capital deployment strategies, we conducted capital market research on the oil and gas industry. We studied 64 of the largest companies in the industry of which 26 are integrated oil or exploration and production (E&P) companies that own reserves, and the rest are in the service, equipment, drilling, storage, transportation, refining, and marketing segments. We examined how the reinvestment and distribution patterns influenced total shareholder return (TSR), which is the combined annual return from dividends and share price appreciation.
Over the decade ending in 2009 these companies exhibited widely varying reinvestment rates and distribution rates. The top 10 companies with the highest reinvestment rates deployed an average of 158% of cash flow they generated back into the business. To do this, they raised capital through borrowings, share issuances, and other sources. The bottom 10 reinvested only 65% of their cash flow.
So how did these companies do? An investment spread evenly across the top reinvestment companies at the start of the decade would have grown in value by nearly three times that of an equal investment in the low reinvestment companies. In simple terms, the companies that reinvested more delivered superior returns to shareholders.
Distributions had the opposite impact. The top 10 companies with the highest distribution rates gave 53% of their cash flow back to investors in the form of dividends and share repurchases while the bottom 10 distributed less than 1% of their cash flow. In this case, an investment spread evenly across the top distribution companies at the start of the decade would have grown in value by less than a third that of an equal investment in the low distribution companies. The companies that distributed more capital in the form of dividends and share repurchases delivered inferior returns to shareholders.
Comprehensive capital deployment findings
Every company is unique but one of the most significant differences across our sample of companies is whether they do or do not own hydrocarbon reserves. We separated the 26 integrated oil and E&P companies and studied them separately. Then we turned to the rest of the sample.
To explore the reinvestment and distribution relationships further we separated our reserve owning sample into three equally sized clusters based on their average reinvestment rate over the decade and studied the distribution of total shareholder returns for the high, medium and low reinvestment groups. We then replicated this analysis for the high, medium, and low distribution groups.
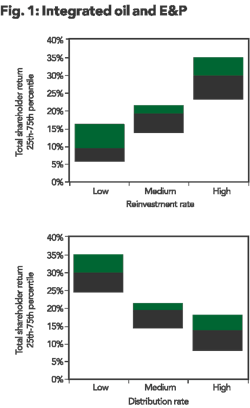
In Figure 1 we see that high reinvestment companies have delivered much higher TSR and the opposite is true for the high distribution companies.
Why have "high" investment companies performed so much more positively than to those that distributed more of their cash flows? Perhaps it is because companies in this industry truly can create value more often than not when they invest in the business. To test this, we did a separate analysis of operating performance and found that over the 10 years of the study, all of these companies' generated average cash on cash returns on capital in excess of investor required returns (which is similar to a cost of capital).
The most puzzling question is why investors and analysts often petition management to increase dividends and share repurchases. For reserve owning companies, our capital market research findings raise questions about whether these demands are desirable. While some companies generate so much cash flow that it is hard to deploy a high percentage of that cash flow profitably, when the reinvestment rate declines a company may be sacrificing some upside in share price performance.
The range of TSR outcomes for the low, medium, and high reinvestment and distribution groups is fairly tightly clustered, indicating the reinvestment rate is a strong driver of share price performance among these reserve owning companies. We have studied many industries and this is one of the strongest relationships we have seen. Reinvestment has been one of the most powerful drivers of TSR in reserve owning companies.

In a sense, this is to be expected. There were strong rising commodity prices over much of the decade and even though there was substantial volatility, especially in gas, commodity prices ended the decade higher than they began it. As shown in Figure 2, from the end of 1999 to the end of 2009, the West Texas Intermediate (WTI) oil price was up 184% and the Henry Hub natural gas price was up 152%. In such an environment, the benefits of reinvestment are plentiful as acquired reserves typically grow in value as the spot commodity prices rise. The more you buy, the greater the capital appreciation on the assets you bought.
Will reinvestment rates show such a strong correlation with TSR in the future for reserve owning companies? This depends on what happens to commodity prices. If the underlying trend is that oil and gas prices continue to rise over time, then yes high reinvestment rates will be sure to pay off. If commodity prices stagnate, reinvestment may still be a strong positive driver of success, but some companies will exhibit poor timing and will invest when reserves are highly priced and their growth strategy may not create value. And of course if commodity prices trend down, then high reinvestment rates may generally turn out to be a bad idea, depending on how far prices decline.
Does reinvestment show a strong positive correlation with TSR for non reserve owning companies in the energy field? We examined the 38 companies in the service, equipment, drilling, storage, transportation, refining, and marketing segments, and again, we separated the sample into high, medium, and low groups based on their reinvestment and distribution rates. In this instance, the results are anything but clear, as shown in Figure 3.
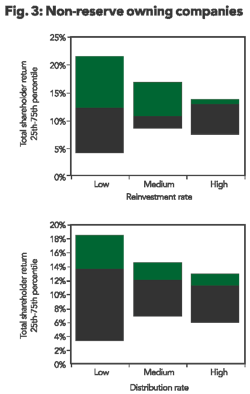
The reinvestment rate does not seem to be a critical driver of success in the non reserve owning companies. These companies differ dramatically in terms of product or service differentiation which leads to vastly different opportunities to deliver the right balance of profitability, capital intensity, prudent risk taking, and competitive success. Our research findings suggest that these and other factors are more important in driving share prices than just the reinvestment and distribution rates.
Just as the reserve owning companies should reinvest at a high rate when commodity prices are rising, non reserve owning companies should invest at a high rate when their differentiation, efficiency, and growth opportunities are on the rise.
TSR and job creation
Our research focused on the reinvestment and distribution drivers of shareholder value but some might ask what is in it for other stakeholders. These days, a common concern is job creation, and the media often seem to present this as a battle between shareholders and employees as if what is good for one is, by design, bad for the other and vice versa. So the question we ask is whether delivering higher total shareholder returns is good or bad for job creation.

As shown in Figure 4, the top shareholder value creators increased the number of employees at an average rate of 11% per year while the lowest TSR companies grew jobs at only 4% per year.
In the oil and gas business, the interests of employees and shareholders seem to be very well aligned. This is significant as it implies that when companies focus on the growth and efficiency objectives implied by a shareholder value focus, they typically create jobs.
Implications for strategic decision making
The reinvestment rate is an important driver of TSR and should be a prominent and deliberate strategic discussion point. The goal should not be to maximize the rate of return but to balance the pursuit of higher returns with adequate reinvestments in growing the business.
Are you reinvesting enough? As commodity prices continue to soar, CFOs should assess their companies' reinvestment rates to ensure enough capital is being deployed to build future value via capital expenditures, R&D, and maybe even acquisitions. Executives should ask themselves these key questions to determine if they are investing enough for the future:
- Within your company, what are the reinvestment rates across business units and is capital investment occurring where the returns and opportunities are highest?
- Are all business management processes aligned with maximizing value or are there biases against reinvestment? Consider adding the reinvestment rate to planning and performance-measurement processes. In doing so, avoid measuring and benchmarking investment as a percent of revenue, since that creates a bias in favor of less profitable businesses.
- Are these disciplines reinforced in planning, capital investment, and performance review meetings? Make sure everyone understands that value is not created from maximizing returns, but from balancing the pursuit of higher returns with investment in future growth.
Understanding and relentlessly pursuing shareholder value through the right balance of investing in growth and delivering returns can have a profound impact on the company and often requires a heightened sense of urgency which needs to and can only come from the top. OGFJ
About the authors

More Oil & Gas Financial Journal Current Issue Articles
More Oil & Gas Financial Journal Archives Issue Articles
View Oil and Gas Articles on PennEnergy.com