The calm before the boom: Pipeline costs appear to fall as project proposals triple
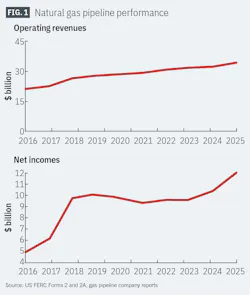
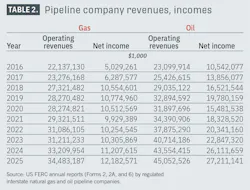
US oil and natural gas pipeline operators’ revenue grew for another year, but overall gains in 2025 were less than those in 2024. Net incomes for gas pipelines were up for a fourth straight year, reaching a record $12.1 billion (Fig. 1). Natural gas pipeline operators’ net incomes as a share of revenue topped 35%, continuing to climb toward the 39% level achieved in 2018.
Oil pipeline operators’ net incomes, meanwhile, slowed from the rapid growth in 2024, though still reaching a new all-time high. The 4.81% increase in liquids pipelines’ earnings marked the first single-digit increase after three years of double-digit increases in a row. Oil pipeline earnings as a percent of net income also continued to improve, eclipsing the 60.13% high in 2019.
The expected cost per mile to build pipelines has fallen significantly for land pipeline additions proposed in the past year, reaching a 5-year low of $6.4 million/mile, driven by lower estimates across all cost categories. Estimated miscellaneous costs decreased most significantly, to less than half of last year's levels. Within the miscellaneous budget, “contingencies” continued to be the most variable of the costs. The amount set aside for such purposes is largely to account for potential cost uncertainty driven by market factors or delays caused by opposition to particular projects. The significant fall in miscellaneous costs may reflect a shift to more confidence in the project development landscape.
On the other hand, estimated costs for compression increased slightly, accompanied by a 5-year high of just less than 900,000 hp of new proposed projects.
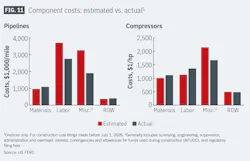
For pipeline projects completed in the 12 months ending June 30, 2026, actual land construction costs were roughly $2.2 million/mile less than initial estimates, with the largest difference seen in estimated vs. actual miscellaneous costs, which more than outstripped the overruns encountered in material and right-of-way costs.
US pipeline data
At the end of this article, two large tables (linked) offer a variety of data regarding US oil and gas pipeline companies: revenue, income, volumes transported, miles operated, and investments in physical plants. These data are gathered from annual reports filed with the US Federal Energy Regulatory Commission (FERC) by regulated oil and natural gas pipeline companies for the previous calendar year.
Data are also gathered from project applications filed with FERC by those regulated natural gas pipeline companies seeking approval to add transportation capacity. OGJ keeps a record of these filings for each 12-month period ending June 30. Combined, these data allow an analysis of the US regulated interstate pipeline system.
Annual reports. Companies that FERC classifies as involved in the interstate movement of oil or natural gas for a fee are jurisdictional to FERC, must apply to FERC for approval of transportation rates, and therefore must file a FERC annual report: Form 2 or 2A, respectively, for major or nonmajor natural gas pipelines; Form 6 for oil (crude or product) pipelines.
The distinction between “major” and “nonmajor” is defined by FERC and appears as a note at the end of the table listing all FERC-regulated natural gas pipeline companies for 2025.
The deadline to file these reports each year is in April. For a variety of reasons, companies often miss that deadline and apply for extensions but eventually file an annual report. That deadline and the numerous delayed filings lead OGJ to publish its report on pipeline economics later in the year. Earlier publication would exclude many companies’ information.
Application filings. When a natural gas pipeline company seeks to develop and construct a new interstate system or modify its existing FERC-regulated system, it must apply for a “Certificate of Public Convenience and Necessity.” This filing must explain in detail the planned construction, justify its need in the marketplace, and––except in certain instances—specify what the company estimates construction will cost.
Most, but not all, project applications are approved. In some cases, approved projects are never constructed, typically due to difficulty obtaining key state permits or lengthy battles with opposition in the courts. But assuming a company receives its certificate and builds its infrastructure, it must—again, with some exceptions—report back to FERC how original cost estimates compared with what was spent once the project is placed into service.
Reporting changes
The number of companies required to file annual reports with FERC may change from year to year, with some companies becoming jurisdictional, others becoming nonjurisdictional, and still others merging or consolidating out of existence. Such changes require care to be taken in comparing annual US petroleum and natural gas pipeline statistics.
Reports for 2025 show a slight increase in FERC-defined major gas pipeline companies: 106 of 181 companies filing, from 104 of 175 companies filing in 2024.
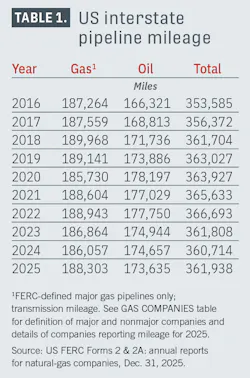
FERC-regulated major natural gas pipeline mileage grew in 2025 (Table 1), with an increase of 2,246 miles, or 1.19%. Most of this increase can be attributed to existing pipelines now reporting system mileage as a major operator, rather than significant increases to existing pipe in the ground. On the other hand, oil pipeline mileage fell by 1,022 miles for a loss of 0.59% from 2024.
Financial performance of existing infrastructure
Natural gas pipeline companies in 2025 grew revenues again for the ninth-straight year, though growth slowed slightly from last year, falling from $2 billion in 2024 to roughly $1.3 billion (4.1%) in 2025. Despite the slowdown in revenue growth, net income growth was even stronger than in 2024 for a fourth-consecutive annual increase; up 9.46% or roughly $975 million in 2025, compared to 2024’s $900 million growth.
Oil pipeline earnings continued the return to growth started in 2021, climbing roughly $1 billion (4.8%), significantly lower than 2024’s earnings growth of $3.3 billion. Revenues rose for the second year in a row, by about $1.5 billion (3.7%), just under half of 2024’s $2.8 billion revenue growth (Table 2). The slowdown in liquids pipeline earnings growth can be at least partially attributed to the 5.1% decrease in crude deliveries. For comparison, crude oil deliveries increased by 11.75% in 2024.
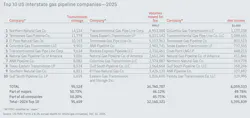
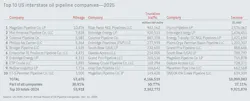
OGJ uses the FERC annual report data to rank the Top 10 pipeline companies in three categories (miles operated, trunkline traffic, and operating income) for oil pipeline companies and three categories (miles operated, gas transported for others, and net income) for natural gas pipeline companies.
Positions in these rankings shift year to year, reflecting normal fluctuations in companies’ activities and fortunes. But also, because these companies comprise such a large portion of their respective groups, the listings provide snapshots of overall industry trends and events.
For instance, earnings for the Top 10 oil pipeline companies rose by 1.8% compared with the 4.8% overall increase for the segment. In contrast, Top 10-company trunkline traffic rose by 25% as overall traffic increased by only 15.8%.
Earnings by the Top 10 most-profitable gas pipeline companies grew by 12.3%, driven partially by a 9% increase in volumes moved for a fee, on a combination of improved efficiencies and higher shipping rates.
As noted earlier, net income as a portion of natural gas pipeline operating revenues rose to 35% in 2025, the third year in a row of increases after slipping to 32.99% in 2022. The percentage of income as operating revenues for oil pipelines hit a record of 60.4%, eclipsing 2019’s high of 60.13%. It’s the fifth consecutive annual increase after this metric collapsed to 48.53% in 2020.
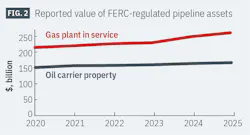
Net income for major natural gas pipelines as a portion of total gas-plant in service increased slightly to 4.65% in 2025 from 4.61% in 2024. Net income as a portion of total oil pipeline owned carrier property grew to 16.2%, passing 2024’s high of 15.9%.
Fig. 2 shows how gas plant and oil carrier property has changed since 2020. Major and nonmajor natural gas pipelines in 2025 reached their highest-ever reported total gas plant in service of roughly $261 billion. Owned oil-carrier property also continued to grow, reaching a new high of $168 billion in 2025.
For many years, OGJ has tracked carrier-property for five pipeline companies each for crude oil and products, chosen as representative in terms of physical systems and expenditures (Table 3).
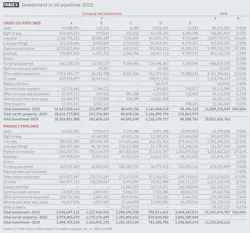
The value of carrier property owned by five crude oil pipeline companies in 2025 increased by roughly $228 million (0.5%). The five products pipeline companies’ overall value of carrier property increased almost 3% in 2025, about $306 million.
Comparisons of data in Table 3 with previous years must be done with caution as reorganizations, mergers, acquisitions, and sales can make comparisons with previous years difficult.
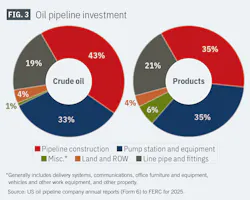
Fig. 3 illustrates how the value of different components making up oil pipelines in the crude oil and products companies were divided.
Proposed construction
Applications to FERC by regulated interstate natural gas pipeline companies to modify certain systems must, except in certain instances, provide estimated costs of these modifications in varying degrees of detail. Tables 4 and 5 show companies’ estimates during the period July 1, 2025, to June 30, 2026, for what it will cost to construct a pipeline or install new or additional compression.
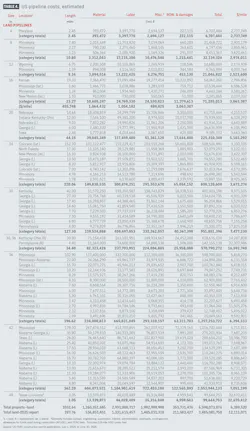
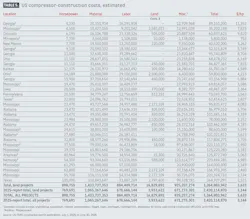
These tables cover a variety of locations, pipeline sizes, and compressor-horsepower ratings. Most, but not all, project applications are approved. In some cases, approved projects are never constructed.
- A total of 1,032 miles of pipeline were formally proposed to FERC for land construction in the 12 months ended June 30, 2026, with no offshore work submitted: more than 3.5 times the mileage submitted in 2025. Fig. 4 shows how rapidly the proposed mileage increased when compared with the previous 5 years.
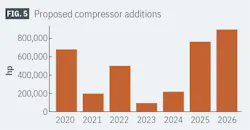
- A smaller increase occurred for new or additional compression proposed by the end of June 2026, which totaled a recent high of nearly 900,000 hp, up from the June 2025 total of almost 770,000 hp. Proposed compression additions have been more variable over the last 5 years than their pipeline counterparts, as shown in Fig. 5.
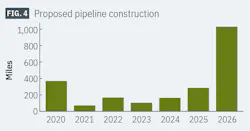
The significant increase in proposed pipeline mileage can be attributed to many factors. From 2021 to 2023, it was exceptionally difficult to permit pipeline projects, and even minor projects faced significant opposition from major environmental groups. Demand for new transportation capacity was low in almost all of the country. As a result, proposed pipeline projects were primarily minor loops, short laterals, or small replacements.
Since the beginning of 2025, the need for new pipeline infrastructure has exploded, driven primarily by significant demand growth from LNG and data centers. Pipeline developers are working to get as much pipe in the ground as quickly as possible, especially since a gas-friendly presidential administration may only last for the next 2 years.
Proposed horsepower additions have not changed at the same level as pipelines for a few reasons. Compression was not as difficult to permit or as heavily opposed as pipeline projects, so many developers introduced modest compression additions to their systems for incremental capacity additions or reliability improvements from 2021 to 2023. Because compression is generally easier to permit and less opposed than pipeline projects, it is logical that developers are now prioritizing new pipeline construction over compression additions, which can be done later for additional capacity expansion.
Putting US gas pipeline construction in perspective, Table 4 lists 59 land-pipeline “spreads,” or mileage segments, and 0 marine projects proposed from 2025 to 2026, compared with:
- 17 land and 0 marine projects (OGJ, Sept./Oct. 2025, p. 24)
- 4 land and 0 marine projects (OGJ, December 2024, p. 24).
- 5 land and 0 marine projects (OGJ, Oct. 2, 2023, p. 20).
- 19 land and 0 marine projects (OGJ, Oct. 3, 2022, p. 31).
- 9 land and 0 marine projects (OGJ, Oct. 4, 2021, p. 52).
- 18 land and 0 marine projects (OGJ, Oct. 3, 2020, p. 42).
Some projects report estimated costs for multiple spreads individually; others report a single cost for multiple spreads, so 59 is not the total number of pipeline projects nor the total number of pipeline segments proposed across all projects this year.
Only three spreads in 2026 measured 50 miles or more: a 42-in. OD transmission line running 178 miles and a 36-in. OD running 103 miles through Mississippi, and a 24-in. OD “lateral” running 152 miles in Colorado.
Like 2024, many of the 2025 proposed pipeline spreads are large diameter pipeline loops, aimed at increasing capacity through existing congested areas of the pipe. In 2025, there are significantly more of these loops proposed in many more areas of the country.
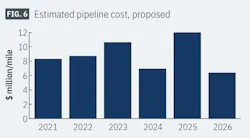
For the 12 months ending June 30, 2026, the 59 land projects filed would cost an estimated $6.6 billion, nearly double the expected outlay for the 18 land projects filed for $3.5 billion a year earlier. Estimated 2025-26 $/mile construction costs for new onshore projects as filed with FERC fell by roughly $5.7 million, reaching a new 5-year low of $6.4 million/mile. Fig. 6 shows how estimated costs have varied over the last 5 years.
These statistics cover only FERC-regulated pipelines. Many other pipeline construction projects were announced in the 12 months ending June 30, 2026, but were outside FERC jurisdiction.
Completed project costs
Variations over time in the four major categories of pipeline construction costs—material, labor, miscellaneous, and right of way (ROW)—can reflect both general economic and political trends and specific regional and temporal dynamics.
- Materials can include line pipe, pipe coating, and cathodic protection.
- Miscellaneous costs generally cover surveying, engineering, supervision, contingencies, telecommunications equipment, freight, taxes, allowances for funds used during construction (AFUDC), administration and overheads, and regulatory filing fees.
- ROW costs include obtaining rights-of-way and allowing for damages.
- For the 59 spreads filed in 2025-26, estimated project cost-per-mile decreased by a significant percentage in all categories, with the largest percent and total change both in expected miscellaneous costs.
In 2011, miscellaneous charges passed material to become the second most expensive cost category and in 2017 passed labor costs to become the most expensive category of all. The two categories eventually flipped again, with labor spending 5 years as the most expensive category before surrendering the position back to miscellaneous in last year’s report. In 2025, labor is back on top as the most expensive category—by a large margin. A breakdown of 2025-26 costs shows:
- Material—$1.2 million/mile, down more than a third from the $1.9 million/mile for 2024-25.
- Labor—$3 million/mile, a $1.6 million/mile decrease from $4.6 million for 2024-25.
- Miscellaneous—$1.9 million/mile, down about $3 million/mile from the estimated $4.9 million/mile for 2024-25.
- ROW and damages—$342,551/mile, down more than half from $735,277/mile in 2024-25.
The average cost-per-mile for projects rarely shows clear-cut trends related to length or geographic region. However, the cost-per-mile for a given diameter generally decreases as the length in miles rises. Table 4 lists proposed pipelines in order of increasing size (OD) and decreasing lengths within each size. Lines built closer to populated areas also tend to have higher unit costs. Additionally, road, highway, river, or channel crossings and marshy or rocky terrain each have a strong cost influence.
There were a number of reasons expected 2025 costs were lower:
- Most of the proposed pipeline segments are much longer than those proposed in 2024, which typically results in lower costs per mile.
- Lower materials costs may partially be explained by lower prices after years of low demand. We’ll be watching for this trend to reverse with a new buildout under way.
- Lower labor costs are likely due to the vast majority of proposed projects’ locations in the Southeast, where labor is typically less expensive and terrain is easier to manage.
- Lower miscellaneous costs may be due to significant overestimations in legal and contingencies budgets in 2024 combined with the fact that projects in the Southeast generally experience less opposition and delays, so operators may be less worried about budgeting for these things.
- Lower ROW costs can also be attributed to project location, combined with the fact that many are loops of existing systems, where it is probable developers already own significant portions of the land needed to construct.
Fig. 7, derived from Table 4, shows cost-component splits for pipeline construction. Labor’s 2026 portion of estimated costs (45.3%) rose sharply from last year’s 30.5%, but is still below the recent high of 52.4% in 2020. Because labor is almost half the estimated project cost, this also supports the theory that the heavy skew towards projects in the Southeast is driving down construction costs.
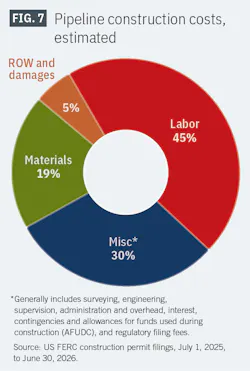
Material costs’ portion of land pipeline costs also increased, from 15.4% in the 2025 report to 19.1%. Both are up from a low of 8.7% in 2023, but still down from material’s peak of 22.5% in 2022. This could be explained primarily by the fact that longer segments of pipeline cost more, but don’t necessarily cause other miscellaneous costs to rise. It could also be in part due to increasing demand for the physical pipe and the related anticipated effects of tariffs and changes in steel prices.
Fig. 8 plots a 10-year comparison of land-construction unit costs for material and labor.
Fig. 9 shows the cost split for land compressor stations based on data in Table 5.
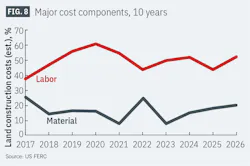
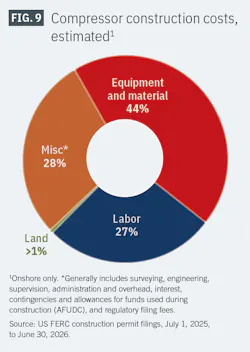
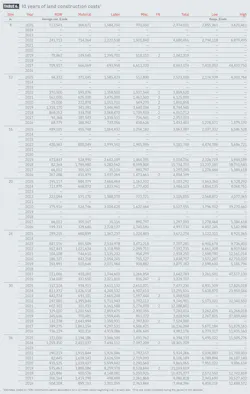
Table 6 shows that the average cost per mile for any given diameter may fluctuate year-to-year as projects’ costs are affected by geographic location, terrain, population density, and other factors. As a result, the overall falling cost of pipeline projects per mile does not necessarily mean that construction costs are going down.
Completed project costs
In most instances, a natural gas pipeline company must file with FERC what it ultimately spent on an approved and constructed project. This filing must occur within 6 months of a pipeline’s successful hydrostatic testing or a compressor station’s placement into service. Therefore, the variance between a project’s estimated and actual costs can be calculated and analyzed.
Fig. 10 shows 10 years of estimated vs. actual costs on cost-per-mile bases for project totals.
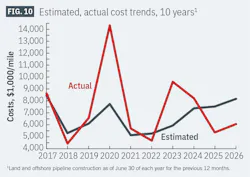
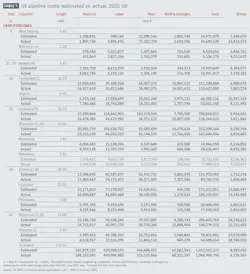
Actual costs for pipeline construction were roughly $2.2 million/mile less than estimated costs for the same project. Material costs were more than estimated (by about $126,000/mile) and ROW was more expensive, but not by enough, even when combined, to make up for lower actual labor costs. Final miscellaneous costs are almost always lower than estimated because of the contingencies budget, which generally gets reallocated to other cost categories which exceed expected spend. If a project was reported in construction spreads in its initial filing, that’s how projects are broken out in Table 7. In some cases, developers report a single final project cost for all pipeline and compressor station costs.
The 12 months ending June 30, 2026, saw more than 151,000 hp of compression completed, down nearly 100,000 hp from the year before. Actual total costs of $4,182/hp were up from $3,463/hp the year before and just 3% lower than estimates. Fig. 11 also shows how estimated versus actual cost allocations for compressor projects ended up for projects placed into service over the last year. Actual miscellaneous and land costs were lower than project estimates, while materials and labor ended up costing more than expected.
The US pipeline industry is entering a new phase of growth. After 6 years of stifled infrastructure development, the rapid rise in demand from data centers and LNG exports has prompted a surge of proposed large-scale infrastructure projects concentrated primarily on moving supply out of the Gulf Coast region.
With much of this proposed infrastructure concentrated in the Gulf Coast and Southeast, developers are benefiting from favorable terrain, lower labor costs, and, in many cases, existing rights-of-way. While estimated per-mile project costs appear to have fallen when compared with the previous several years, this may prove to be more of a one-time effect due to the factors just listed, rather than indicative of trends. These estimates may also prove to be optimistic as developers compete for construction resources and encounter unexpected delays from permitting, opposition, and litigation. Once takeaway capacity from the Gulf Coast is placed in service, future infrastructure may be required closer to emerging domestic demand in regions where projects are much more expensive to construct.
The author
Reilly Meinert is the manager of analytical services at Arbo, an energy infrastructure intelligence firm that transforms regulatory and legal data into actionable commercial insights for pipeline developers and energy traders. Meinert has deep expertise in myriad gas infrastructure datasets, especially pertaining to FERC Certificate projects. At Arbo, she develops predictive models and data visualizations to help customers forecast costs and schedules and quantify non-technical risks. Reilly earned dual undergraduate degrees in computer science and statistics from the University of Virginia and an MS in data science from The University of Virginia.