Satellite-based radar assesses CNPC management of crude pipelines

Gabriel Collins
Baker Institute for Public Policy
Houston
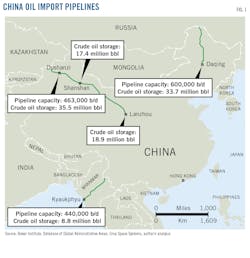
Oil inventories measured by satellite-based synthetic aperture radar can help market participants and policymakers more accurately assess how China National Petroleum Corp. (CNPC) is managing the pipelines that carry crude oil into China from Kazakhstan, Myanmar, and Russia. With a combined capacity of nearly 1.5 million b/d, these four pipelines (one from Kazakhstan, one from Myanmar, and two from Russia) are significant parts of the global crude delivery system (Fig. 1).
This article features some of the first publicly available research to use oil inventory data derived from satellite-based synthetic aperture radar. The underlying study is also the first project to use such data to assess the operations of strategic oil supply assets in China. Ursa Space Systems provided about 2 years of weekly inventory data covering Kyaukphyu, Myanmar (Myanmar-China oil pipeline), Daqing, China (Russia-China oil pipeline), and Dushanzi and Lanzhou, China (Kazakhstan-China oil pipeline).1 Combined storage capacity is roughly 105 million bbl of crude according to Ursa’s measurements, or about 25% more than the storage hub at Cushing, Okla. For data verification purposes, Ursa satellite data are cross-referenced with other sources including US Energy Information Administration (EIA) data, local Chinese and Russian language data sources, and company reports.
Satellite data
Before the availability of satellite inventory data, pipeline import activity could be approximated using monthly information published by China’s General Administration of Customs for crude oil imports at specific entry points. But in March 2018 the Chinese government stopped providing this monthly port-level import data to Bloomberg, leaving a major data gap for analysts.
Access to Ursa’s data provides weekly insights into oil inventory levels worldwide, a feat not possible just 5 years ago and one that is especially difficult in China given that oil storage information is a closely-guarded state secret.2 The Chinese government and its state oil firms have historically disclosed little information about operations of the country’s crude import pipelines. Such reticence may stem from a belief that the pipelines can provide a strategic hedge against potential maritime interdiction of oil imports into China and are thus national security assets.3
Ursa’s radar-based approach yields oil inventory measurements regardless of cloud cover, air pollution, or other meteorological obstacles, and it allows researchers to efficiently and accurately cover a huge geographical span. It must, however, be recognized that radar observation of oil storage has limits. Future oil storage in China might either be built underground or use fixed-roof tanks that thwart radar measurement of tank level changes,2 and existing tanks could be retrofitted with fixed aluminum roofs, although this can cost more than $1 million/tank.2 However, a substantial proportion of crude oil storage capacity in China likely will remain accessible to space-based observation for years to come. Moreover, as access to such data is relatively new, the pathways opened by satellite commodity tracking data are still in the early stages of analytical exploitation.
CNPC pipeline management
Oil storage helps both buffer changes in supplies to a pipeline or refinery and operational shifts such as maintenance-related closures. More generally, storage terminals provide reserve capacity against disruption of supplies by natural disasters, geopolitical events, or other factors. Storage capacity also serves a financial interest by allowing traders to monetize shifts in the forward oil price curve through either hedging or speculative activity, albeit with different motives. The data used in this analysis suggest that oil storage associated with China’s import pipelines primarily fulfills commercial and operational-stability purposes.
Myanmar-China
The Myanmar-China pipeline entered service April 2017, extending 1,400 km from the Indian Ocean port of Kyaukphyu to CNPC’s Anning refinery in Yunnan Province, just outside the city of Kunming.4 Several factors drove the pipeline’s construction, including Chinese central government concerns about the security of oil imports through the Malacca Strait, the central government’s desire to use large infrastructure projects to promote development in certain regions of China, and Yunnan provincial government and local officials’ concern about local high gasoline and diesel fuel prices.5
Initial data suggest the line is running in a volatile feast-or-famine mode dictated by the frequency of incoming tankers, is generally running far below nameplate capacity, and that operations have not been optimized for stability in ways that analogous projects elsewhere are (such as the Trans-Alaska Pipeline system).
The Kyaukphyu terminal is a useful proxy for Myanmar-China oil pipeline operations. No other large-scale crude oil pipelines serve the Kunming area, so the Myanmar-China pipeline’s operating rate likely reflects the Anning refinery’s run rates. As of April 17, 2019, local media reported that since its inception, the Myanmar-China oil pipeline had delivered 17.8 million tonnes of crude, representing an average flow rate of 192,000 b/d.6 The average outbound rate implies that the pipeline can drain a very large crude carrier (VLCC) in about 10 days.
Crude can be offloaded much more quickly into the terminal’s storage tanks. For instance, the Louisiana Offshore Oil Port can offload tankers at rates as high as 2.4 million b/d.7
Ursa’s data show significant volatility, however, in the utilization rate for the 8.8 million bbl of storage at the Kyaukphyu terminal. In late February 2018 the terminal was more than 80% full and by late May of that year was only about 24% full (Fig. 2).
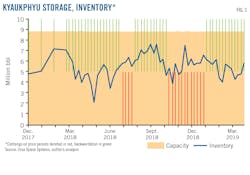
Total storage capacity remained steady during that time implying little influence on utilization rates. Volatility in utilization makes sense when one considers inbound oil shipments come by tanker. A single VLCC hauling 2 million bbl, nearly 25% of the site’s storage capacity, can be fully offloaded into storage within 2-4 days.
While the dataset for Kyaukphyu is still brief—less than 2 years of history—the data suggest that operational concerns dominate CNPC’s management of the facility, as flows appear much more driven by ship arrivals than by oil price movements.
Russia-China
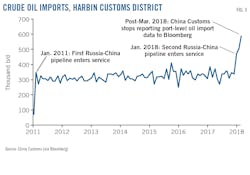
The Russia-China pipeline system links the East Siberia-Pacific Ocean pipeline at Skovorodino (70 km north of the Chinese border) to Daqing approximately 1,000 km to the south. Trunk pipelines originating in Daqing move crude to multiple refining centers on Bohai Gulf near Beijing, Tianjin, and Dalian. The first line entered service in January 2011 and the second in January 2018.8 Each line can move about 300,000 b/d.
Russian sources say the system will reach its full design rate of about 600,000 b/d in 2019.8 Crude oil import data for the Harbin Customs district show that by March 2018—when the Chinese government stopped reporting such data to Bloomberg—the area already had crude imports of nearly 600,000 b/d (Fig. 3).
While imports of oil from Russia have jumped in the past 2 years, local production in the Daqing field (China’s largest) has steadily fallen since 2014 and now stands slightly above 600,000 b/d, roughly the same as the volume coming by pipe from Russia. Despite a net increase in oil availability of more than 250,000 b/d since 2018 (36,000-b/d decline in Daqing output offset by a 300,000 b/d increase from Russia), Daqing’s inventory levels have steadily trended downward since late 2017, suggesting more of the Russian oil is headed to refineries than is being stored at Daqing (Fig. 4).
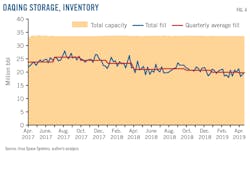
High-capacity crude pipelines also connect Daqing to Dalian and other major refining centers along Bohai Gulf. These coastal refineries lie near some of China’s largest gasoline markets, such as Beijing and Tianjin, so refining and product transport economics may prioritize sending Russian crude south to be refined near major end-use markets. The fact that CNPC has not expanded its storage capacity at Daqing despite a significant net increase in crude oil supplies through the region also signals that the company likely plans to emphasize moving oil to refineries rather than using the area as a strategic storage base and believes that Daqing’s terminal decline will preserve sufficient spare inventory capacity for future storage needs.
Kazakhstan-China
The Kazakhstan-China pipeline entered service in 2006, and by 2017 delivered an average of 330,000 b/d of Kazakh and Russian crude to the Chinese market. These supplies complement Xinjiang’s local crude production, roughly 530,000 b/d in 2018.9 Refineries at Dushanzi, Urumqi, and Lanzhou, connected to the Kazakhstan-China pipeline and the Western Crude Pipeline it empties into, can collectively absorb 670,000 b/d.10 Refineries at Tahe and Karamay, in Xinjiang but away from the trunkline, can process a combined 200,000 b/d. There is also a smaller volume of local production (~55,000 b/d) from Qinghai and Gansu that is refined locally. In summary, about 915,000 b/d of crude oil flows in an area where actual working refinery capacity at any given time is likely around 700,000 b/d (assuming 80% capacity utilization).
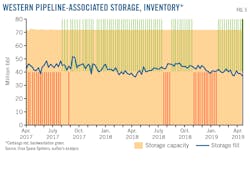
Flows along the pipeline are balanced by 72 million bbl of storage at Dushanzi, Shanshan, and Lanzhou (Fig. 5).
From April 2017 through April 2019, capacity utilization of the four storage sites on the trunk oil pipeline through western China averaged between 45% and 80% (Fig. 6).
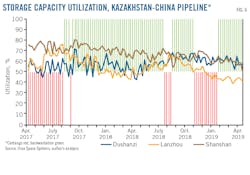
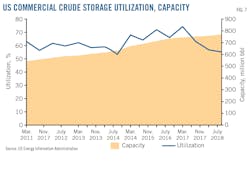
This suggests several things. To begin, despite political emphasis on overland import routes, the Chinese government likely recognizes that the Central Asia system has limited potential for expanding crude oil supplies. Second, current storage utilization of 50-70% is similar to overall commercial crude oil storage rates seen in the US for the past 7 years (Fig. 7).
Notably, CNPC has not boosted overall storage capacity on the Western Pipeline Corridor during the past 2 years despite China’s overall oil demand growth. This yields a few important insights. First, oil demand growth is primarily driven by the country’s east coast and populous central region. Second, Kazakhstan’s ability to expand oil exports to China is likely constrained, which reduces the need to expand tankage. Third, strategic petroleum reserves are most effective when located near high-capacity refining and demand centers and strongly interconnected pipeline networks for distribution of the resulting refined products. Western China generally lacks these characteristics.
Oil price effects
The Ursa data strongly suggest CNPC is operating its overland oil pipelines based on stability of supply, with maintenance of some strategic barrels along the western China route from Kazakhstan. This accords with other investigators’ findings. For instance, one set of academic researchers concluded, based on inventories and sales between 1990 and 2012, that CNPC did not meaningfully engage in speculative trading of crude oil.12
None of the storage hubs covered in the Ursa data appear to have undertaken meaningful speculative trading activity between April 2017 and April 2019. Neither Dushanzi, Shanshan, Lanzhou, Daqing, nor Kyaukphyu showed clear or significant responses to movements in futures prices. In contrast, consider Cushing, Okla., home to more than 80 million bbl of some of the best-connected crude oil storage in the world, with 3.8 million bpd of inbound pipelines, 3.1 million bpd of outbound pipelines, and linkages to more than a dozen refineries.13 Cushing’s inventory levels generally respond robustly to changes in the term structure of futures, which are proxied here as the spread between the Month 6 and prompt month Brent prices (Fig. 8).
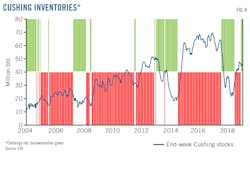
At sites like Cushing, storage levels typically decrease when the oil market is in a state of backwardation—oil price today is higher than the price for future delivery—and traders have incentive to sell down inventory.14 Conversely, when the oil market is in contango—oil price today is lower than price for future delivery—traders have incentive to store oil and sell it forward in the futures market causing inventories to rise.14 Cushing is exceptional for its connectivity and market liquidity. But it is also a great point of comparison for assessing how inventories change in relation to changes in market prices.
The Ursa data suggest that China’s overland oil pipelines operate primarily to provide flow stability. Overland routes also appear to be volume constrained, so strategic volumes in the associated tank farms would not be able to scalably offset import disruptions along seaborne routes that China relies on most heavily. Moreover, the lack of expansion at the storage sites considered suggests that CNPC believes its storage capacity is sufficient to handle operational needs.
China’s import pipelines allow significant access for Russian and Kazakh imports to the Chinese refining market: to Central Sichuan from the Western pipeline system via Lanzhou and all the way to the Bohai Gulf via Daqing. Future domestic crude oil pipeline network expansion would only enhance this connectivity. If Chinese oil security policy begins to more overtly emphasize security of supply, the existing corridors from Kazakhstan and Russia could see capacity expansions aimed at offsetting the country’s growing reliance on seaborne crude oil imports.
Finally, refinery-level storage change data, refinery runs, and tanker arrivals at the Myanmar terminal would allow an analyst to make more granular estimates of pipeline flows. The analysis set forth in this article lends itself to follow-on research by analysts with access to such data.
References
- https://www.ursaspace.com/
- Collins, G. and Hung, E., “Using Satellite Data to Crack the Great Wall of Secrecy Around China’s Internal Oil Flows,” Baker Institute Report No. 09.07.18, Baker Institute for Public Policy, Sept. 7, 2018.
- Erickson, A.S. and Collins G.B., “China’s Oil Security Pipe Dream—The Reality, and Strategic Consequences, of Seaborne Imports,” Naval War College Review, Vol. 63, No. 2, Article 8, 2010.
- Liu, Y.Q. and Yao, B., “China-Myanmar Crude Oil Pipeline Officially Enters China,” Xinhua News Agency, May 19, 2017 (Chinese).
- Liu, D.W., Yamaguchi, K., and Yoshikawa, H., “Understanding the Motivations Behind the Myanmar-China Energy Pipeline: Multiple Streams and Energy Politics in China,” Energy Policy, Vol. 107, 2017, pp. 403-12.
- Zhao, H.B., “China-Myanmar oil and gas pipeline has delivered 20.7 billion cubic meters of natural gas, 17.82 million tons of crude,” ST Daily, Apr. 23, 2019.
- LOOP LLC, “Tanker Offloading,” https://www.loopllc.com/Services/Tanker-Offloading
- Onopriyuk, V., “On the other side of the Amur,” RG.ru, Dec. 16, 2018 (Russian).
- China Reports Net, “From January to December 2018, Xinjiang’s crude oil output was 26.474 million tons, a cumulative increase of 2%,” www.chinabaogao.com, Jan. 23, 2019.
- Hung, E., “China Oil Map,” Center for Energy Studies, Rice University’s Baker Institute for Public Policy, https://www.bakerinstitute.org/chinas-oil-infrastructure/
- “PetroChina Sichuan refinery ready to start after repeated delays-sources,” Reuters, Dec. 18, 2013.
- Diaz-Rainey, I., Roberts, H., and Lont, D.H., “Crude inventory accounting and speculation in the physical oil market,” Energy Economics, Vol. 66, August 2017, pp. 508-522.
- Carr, H., “Oklahoma Swing, Part 4-The Pipelines That Flow Out Of The Crude Hub At Cushing,” RBN Energy, Oct. 7, 2018.
- Morris, S., “Storage, Oil Backwardation, and Implications for MLPs,” Alerian, Apr. 17, 2018.
The author
Gabriel Collins ([email protected]) is the Baker Botts Fellow in Energy & Environmental Regulatory Affairs at the Baker Institute for Public Policy and runs a global energy and water-focused research portfolio. He is a Permian basin native who holds a BA from Princeton University in New Jersey, a JD from the University of Michigan, and is a member of the Texas Water Journal’s editorial board.