Shareholder value and lessons learned
ENERGY COMPANIES NEED TO 'SEE AROUND CORNERS' AND SPOT INFLECTION POINTS IN THE CYCLE
CHRIS ROSS AND VIKRAM ENJAM, UNIVERSITY OF HOUSTON CT BAUER COLLEGE OF BUSINESS, HOUSTON
EDITOR'S NOTE: This article is the first of three from University of Houston C. T. Bauer College of Business professor Chris Ross and UH Bauer College of Business MBA student Vikram Enjam about financial and operational metrics that have driven shareholder returns during the 2002 - 2016 oil and gas cycle.
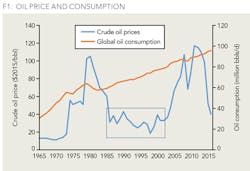
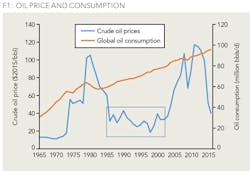
IT WILL NOT SURPRISE ANY investor in the oil and gas and related businesses that theirs is a cyclical business. Prices run up when supplies fall short of demand, hover on the summit for a few years, then tumble as new supply sources are developed and demand growth slows down (Figure 1).
There follows a period in which oil prices are set by the long term marginal costs of the incremental production sources needed to satisfy demand growth and replace declining production from mature oil fields (see box on Figure 1).
In the mid-2000s, we observed that major oil companies were continuing strategies of consolidation and cost control that were designed for the 1990s, focusing on maximizing returns through intense capital discipline. As late as 2006, we found major oil companies that were testing projects economics against the possibility of reversion to $25/ Barrel oil prices. Then they got the message and arguably initiated more projects than they could effectively handle as the whole industry flooded EPC, services and equipment providers with positive final investment decisions. The result was intense cost inflation with completed assets that. The early projects delivered attractive returns; the later projects will struggle to produce an acceptable return on capital. This emphasizes the need to "see around corners" and spot inflection points in the cycle.
This article is the first of three that summarize our findings of financial and operational metrics that in the 2002-2016 cycle seem to have been most influential in driving shareholder returns for Supermajors (IOCs), publicly quoted National Oil Companies (NOCs), and Independent Exploration and Production Companies (Independents). A second article will cover the oilfield Equipment and Service Companies (OFS). A third article will cover Midstream Master Limited Partnerships (Midstream), Independent Oil Refiners (Refiners) and Power Generation Companies (Power).
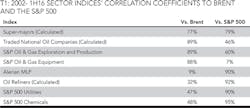
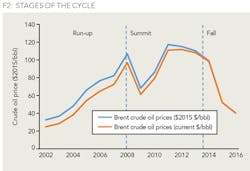
We started with a decision to focus on three stages of the cycle as shown in Figure 2. TSR is highly correlated to oil prices for oil and gas exploration and production, IOCs, NOCs, and related equipment suppliers. Other sectors less so, but TSR for oil refiners, power utilities, and chemicals sectors also appear to be influenced by oil prices, so we investigated whether their TSR drivers changed with the oil price cycle stages.
DRIVERS OF SHAREHOLDER VALUE
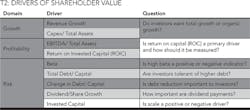
We investigated a wide array of potential drivers of shareholder value for each sector and each time period, and settled on nine important financial measures focusing on reported performance related to Growth, Returns on Capital and Risk (Table 2). We recognize that the financial drivers are themselves driven by fundamental upstream performance in production growth, finding and development costs and lease operating costs, but our purpose here is to focus on the financial performance metrics that ultimately move shareholder value.
Our research sought the financial drivers that were most highly correlated to TSR in each period. In our description of the findings, we identify the drivers that had a greater than 40% correlation coefficient for each sector as being correlated and those with a coefficient above 80% as strongly correlated.
RECURRING PATTERNS
The drivers of TSR in the IOC and Independents upstream sectors followed a similar pattern with some nuanced variation:
- High capital investment during the Run-up and Summit periods, revenue growth during the Summit and sustain as much as possible in the Fall.
- Maintain the highest possible return on capital throughout the cycle.
- Bias toward low debt and growing dividends per share.
NOCs were new in 2002 and needed in the Run-up to prove their ability to operate as commercial entities and show capital discipline. Having succeeded at that, they were encouraged to increase spending and risk during the Summit. Then they had to shrink their business in the Fall.
SUPERMAJORS
In the "Run-up" period, we found no correlation between revenue growth and TSR. However, there was a strong correlation between TSR and Capex/ Total Assets: companies that reinvested most in future projects achieved the highest TSRs. Consistent with that finding, beta was positively correlated with TSR, suggesting acceptance of higher risk; further, growth in dividend per share was negatively correlated with TSR, reinforcing investors' preference for reinvestment in the business rather than returning cash to investors.
This pattern of preferences continued in the "Summit" period with two exceptions: beta was negatively correlated, suggesting greater concerns on risk, and dividend per share growth was positively correlated, reversing the priority in favor of returning cash to shareholders, while continuing to value reinvestment in the business. Consistent with the concern on risk, companies with high total debt/ capital delivered lower TSR than their less leveraged rivals.
During the "Fall" period, TSR was positively correlated with total revenue growth (or least revenue decline), and unlike the earlier stages of the cycle, ROC was positively correlated with TSR. Total debt/assets was positively correlated with TSR, indicating that higher debt levels were tolerated for companies with least loss in revenues and with highest returns on capital.
BP delivered lowest TSR in all stages of the cycle, with lowest EBITDA/Total Assets probably being the root cause of lowest Capex/Total Assets reinvestment. This was exacerbated by the estimated $60 billion costs of the 2010 Macondo disaster.
Statoil showed the highest Capex/Total Assets reinvestment during the Run-up stage and again in the Summit stage, but was penalized for its high and rising debt, such that Chevron recorded the highest TSR. TOTAL demonstrated the highest return on total assets in the Fall stage, while holding reinvestment at a comparable level to Chevron and ExxonMobil.
NATIONAL OIL COMPANIES
Investors showed a preference for companies that demonstrated fiscal discipline: delivering high returns of capital (measured as ROIC) was well received, while TSR was negatively correlated with reinvesting capital in the business, increasing dividends per share. ONGC delivered the highest TSR by its low reinvestment and low debt.
During the Summit period, growth in revenues and reinvestment in organic growth were both positively correlated with TSR, as was high ROC. High total debt/capital was tolerated (positive correlation to TSR) so long as the debt level was declining (negative correlation to TSR).
Sinopec was the TSR leader with highest increase in dividends per share, despite performing poorly on the other TSR drivers. Increasing dividends per share were positively and strongly correlated to TSR. In summary, during the Summit, the NOCs delivering highest TSR grew their business organically and by acquisition, maintaining high ROIC, lowering debt and increasing dividends per share. Smaller NOCs (measured by invested capital) achieved higher TSR than larger NOCs.
In the "Fall" period, the wheels came off for NOCs and the data was distorted by the Petrobras corruption scandal. Revenue growth was negatively correlated with TSR as was beta, high debt level, and change in debt. ROC was strongly correlated with TSR and maintaining dividends was positively correlated. CNOOC was the TSR leader by delivering the second highest EBITDA/Total Assets and reinvestment in capital projects.
INDEPENDENTS
During the Run-up period, independents, like IOCs were rewarded for reinvestment in organic growth and during the summit for revenue growth as the projects were commissioned. However, investors were more attentive to fiscal discipline in this sector than in the IOCs, with high correlation between TSR and ROC) and negative correlation to high debt levels and change in debt. During the "Fall" there was a lower correlation of TSR with organic growth but high correlation to dividend/share growth and strong negative correlation to beta.
In the Run-up stage, Occidental Petroleum and EOG Resources tied for highest TSR: both were leaders in ROC and both had lowest and declining debt; Anadarko provided lowest TSR and had lowest reinvestment and weakest ROC. In the Summit stage, Continental Resources had by far the highest reinvestment level and highest revenue growth; Encana scored poorly on those metrics and had high and rising debt. In the Fall stage, EOG showed its resilience by nearly holding its value while its rivals all suffered substantial value erosion. EOG produced highest ROC and increased dividends per share with below average debt, while maintaining above average reinvestment. Marathon's low returns on capital and low reinvestment resulted in lowest TSR in the sector.
SUMMARY OF RESULTS
The drivers of TSR changed as sectors passed through the stages of the cycle. The key enablers for the upstream oil and gas sector during the Run-up was early recognition that oil prices had passed a point of inflection, requiring a change in strategy from the long grind of the 1990s; the Summit required continued high reinvestment, capital discipline resulting in high returns on capital and low debt laying a strong foundation for the Fall, which favored high returns on capital and sustaining reinvestment, even if that led to higher debt.
Of the integrated IOCs, ExxonMobil, Chevron, and Statoil were fastest off their blocks to create a development pipeline, invest strongly in new projects and deliver highest TSR. Among the NOCs, ONGC led in TSR by demonstrating capital discipline and conservative debt, persuading investors that they would be a safe investment subject to proper fiduciary controls. Among the independents, several companies (Apache, Encana, Devon) successfully executed the "acquire and exploit" model. However, EOG and OXY created greater value through organic growth with a strong focus on the USA leading to higher returns on capital and lower debt levels.
In the Summit stage, Chevron continued to provide highest TSR among the IOCs by strong organic reinvestment and superior returns on capital, while Statoil made several acquisitions increasing its debt burden and falling behind Chevron and Shell in TSR. Low debt had become an important value driver. Sinopec provided highest TSR among NOCs through capital discipline and increasing dividends per share. Independents had to reboot as natural gas prices collapsed, forcing a pivot to oil rich shales. Continental Resources led its peers in TSR by delivering the strongest reinvestment rate primarily in its Bakken acreage and most dramatic increase in revenues. EOG and Noble Energy were close followers.
In the Fall stage, Statoil and Total actually grew TSR by continuing to reinvest, delivering lower declines in revenue than their peers and increasing their debt levels, suggesting that the market was looking beyond the immediate price collapse. Of the NOCs, CNOOC could provide positive TSR by continuing to reinvest while maintaining relatively low debt. Of the independents, OXY leveraged its low debt to register the lowest beta (and cost of capital) of the group with above average EBITDA/Total Assets allowing continued growth in dividends per share and providing lowest decline in TSR.
There are few examples of companies that provided highest TSR in their segment in at least two stages of the cycle.
- In the IOC segment, Chevron committed to an expansive strategy early in the Run-up, delivered highest IOC TSR in the Summit, but then was second only to BP in value loss during the Fall as cost inflation in major projects eroded ROC. Statoil was #1 in the Run-up, in the middle of the pack during the Summit and #2 in the Fall after "cleaning house", taking $65 Billion impairment and asset write downs in 2015.
- Among NOCs, ONGC TSR came in #1 in the Run-up, #2 during the Summit and #2 in the Fall, reflecting better fiscal discipline than its peers.
- Within the Independents, EOG came in #1= in the Run-up, #3 during the Summit and #1 in the Fall, which is exceptional considering its pivots from international to domestic E&P and then from natural gas to oil rich tight rock. Oxy was #1= in the Run-up, in the middle of the pack during the Summit and #2 in the Fall, perhaps benefiting from the diversification effects from its chemicals business.
Looking ahead, the industry is currently in a grind mode, like that endured from 1986-2001 (see box in Figure 1). During that earlier period, major technological advances were made in seismic data acquisition and processing, in deep water engineering and construction, and in organizational design and effectiveness. Newfield Exploration Company emerged from the ashes of Tenneco, and major oil companies tried to emulate their success by separating their Gulf of Mexico operations into Vastar (from Arco) and Spirit (from Unocal). Previously closed regions were opened to foreign direct investment allowing companies to find and develop new discoveries, reinvent the LNG business, and develop oil sands resources in Venezuela and Canada.
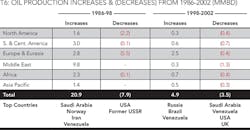
The duration of the grind this time is uncertain and depends greatly on how scalable are existing shale oil plays and whether the US business model can be replicated internationally. Mark Twain noted that "history doesn't repeat itself, but it does rhyme." The prior cycle from 1972-2002 ended with a long grind from 1986-2002; ominously, prices fell substantially from 1986 to 1998 as production in Saudi Arabia (aimed at punishing Venezuela for its rapid production growth) and countries newly accessible to IOCs expanded.
One consequence of the price decline in 1998 was the major oil company mega-mergers. These resulted in high-grading of projects, reduction in aggregate capital spending and slowdown in production increases after 2002, setting the stage for the Run-up in prices after 2002.
As we start the post-Fall Grind this time around, it is important to recognize the differences from the 1986-2002 Grind. In favor of a short rather than long duration:
- Global demand is rising at a lower annual rate, but resulting in similar annual increments as in the previous cycle (13 MMb/d from 1986-98 or just over 1 MMb/d per year compared to IEA Oil Market Report's estimated increase of 4.3 MMb/d from 2014-17 or 1.4 MMb/d per year).
- Total global production in 1986 was 60 MMb/d. By 2015, it had risen to 92 MMb/d. If declines in mature fields average 5% p.a., the required production replacement will rise from 3 MMb/d per year to 4.5 MMb/d per year and will accelerate as funds for EOR projects become scarce in the low-price environment.
- The Middle East has limited spare production capacity.
- US production has been declining since the Fall stage of the cycle. Breakeven costs for deep water and oil sands resources are higher than those for the Permian, so IOCs are slashing capital budgets worldwide and tilting them from international to domestic opportunities.
In favor of a lower for longer duration:
- The currently bloated global inventories will suppress prices into 2017.
- National Oil Companies are strapped for cash and may invite Foreign Direct Investment on favorable terms to stabilize or increase production. IOCs may accept, if the host government accepts most of the price risk.
- The US light, tight oil (LTO) resource is huge and technology is lowering costs, increasing well productivity and may flatten the supply curve. Companies may collectively over-invest in a show of irrational exuberance and kill a price recovery goose before any golden eggs have been laid.
- The US LTO business model may be replicated internationally.
So the most likely scenario is that the business environment will remain hostile through the early 2020s: occasional surges in prices will be extinguished by premature investment. However, the duration of the Grind seems more likely to be five years rather than 15 years. The likely recipe for shareholder value creation will look like the 1990s playbooks and like the success factors identified for the Fall stage of the current cycle:
- Returns on Capital will be the primary driver of shareholder value: harnessing new technology and embedding it in streamlined workflows is a key enabler.
- High ROC will generate sufficient cash to satisfy secondary drivers: sustaining dividends and healthy reinvestment in organic growth without increasing debt ratio.
Leaders will need to be vigilant in "looking around corners" for convincing evidence of a point of inflection that signals a return to a new Run-up in prices, starting a new cycle that will require a shift towards more aggressive growth, with reduced emphasis on dividends and debt. However, there will be false dawns and leaders should be wary of expanding too soon, losing capital discipline and running up debt.
ABOUT THE AUTHORS
Chris Ross ([email protected]) is an executive professor of finance at the CT Bauer College of Business at the University of Houston. He has authored numerous articles on the oil and gas industry and is co-author of Terra Incognita: A Navigation Aid for Energy Leaders. He chairs the Oil and Gas Policy Subcommittee of the Greater Houston Partnership, and sits on the Program Committee of the Offshore Technology Conference. Ross began his career with BP in London. In 1973 he joined Arthur D. Little, and moved to Algeria where he managed a large project office assisting SONATRACH with commercial challenges in oil and LNG and advising on OPEC issues such as price coordination, price indexation, and production quotas. In 1978, he moved to the ADL headquarters in Cambridge, MA and on to Houston, where he opened the ADL office in 1982. From then until 2010 he led the Houston energy consulting practice which was acquired by Charles River Associates in 2002. As a consultant, Ross works with senior oil and gas executives to develop and implement value creating strategies.
Vikram Enjam ([email protected]) is an MBA candidate with a focus on energy at the University of Houston's CT Bauer College of Business. He has more than eight years' experience in the LNG industry. He holds master of engineering and bachelor of technology degrees in mechanical engineering from Lamar University (Texas) and JNT University (India), respectively.
