Shell tests low-cost, real-time oil well surveillance
Several of Shell Group's exploration and production operating units have installed or are testing a low cost and effective well surveillance system.
One operating unit has deployed it, and four other units have successfully tested it.
The benefits of this surveillance system have not yet been fully quantified, but Shell considers the technology mature enough for installation in several of its worldwide operations.
The monitoring system includes low cost, commodity pressure transducers at the wellhead or at the manifold that transmit signals to a supervisory control and data acquisition (SCADA) system or distributed control system (DCS). Software converts the signals in real time to obtain oil, gas, and water flow rates.
Monitors display graphical trends, and software flags deviations from norm as process alarms.
Shell's name for the monitoring system is Fieldware FlowMonitor.
Traditional testing
Effective surveillance requires that one know when a well is off production, producing abnormally low or high, or behaving in an unstable manner. Surveillance will let one know how a well responds to changes in operating parameters, such as gas-lift injection rate, pumping speed, or choke setting.
Operators traditionally test wells by separating oil, water, and gas phases in a vessel and then measuring each phase individually. A number of wells usually share a test separator; hence, well testing is discontinuous-for example one test/month. Test and actual well production conditions may differ due to effects such as backpressure.
Operators need to know when to test a well, and when a test is not needed.
Well surveillance is traditionally a manual process. Operator personnel routinely visit well sites, put wells on test, take samples, and physically inspect the wells to determine any problems.
Often, problems are not found. Consequently, many well site visits are unnecessary. Also, these visits may generate unnecessary lab samples and data that have to be processed, again resulting in much spurious activity.
The large volume of data and errors can obscure a problem or give rise to false and misleading results. For example, well tests frequently have to be repeated, and in some cases well problems are missed due to the shear volume of data.
Remote monitoring
Installation of a wellhead device that can continuously, cost effectively, and accurately measure well productivity is a solution for early detection of well problems and eliminating unnecessary work. This information transmitted to manned monitors can allow the operator to concentrate manpower only on problem areas.
Shell's system continuously determines well productivity by measuring pressure drop (DP) across a fixed restriction in the flowline. The measurement requires a pressure drop of 0.1-1 bar (1.4-14.5 psi) across the restriction. The signal may be telemetered back to a remote control room or to a personal computer in the operator's office.
The operator can place the restriction anywhere in the flowline, from the wellhead to the production manifold. But a wellhead location provides the best accuracy, although a manifold location may be more expedient and cost effective in that a single data-gathering system can handle many wells. The manifold location may also provide access to electricity and be more secure by being within a fenced perimeter.
The surveillance technique, in principle, can be applied to any multiphase flowing well, including wells on gas lift, natural flow, electric submersible pumps (ESPs), etc.
For gas-lifted wells, the calculations should include tubinghead pressure (THP) and injection gas flow rates as well as the flowline DP. Most other applications require only DP.
If backpressure varies significantly, the system should have a combined P/DP meter for pressure compensation and thus greater accuracy.
Well-productivity measurements
The DP from unmanned wells can be continuously transmitted by electronic pressure transmitters to monitors at manned locations through local devices, such as a remote terminal unit (RTU), connected with SCADA or DCS technology.
The RTU digitizes the transmitter output and modulates it onto a communications signal, which is routed back via radio or telephone to the remote SCADA or DCS system. As an alternative, fiber-optic cable can also route the DP signal back to the manned location.
Shell's software package runs in the SCADA or DCS system. It then processes and converts the incoming signals into an estimate of oil, water, and gas flows rate. The software uses the results of previous well tests such as GOR and bs&w estimates for the conversion.
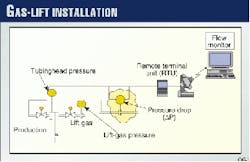
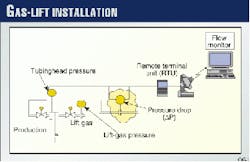
Fig. 1 shows a typical installation for a gas-lifted well.
The system interprets the signal to identify and flag deviations from the norm and then plot the results so that the well "footprint" can be easily scrutinized for behavior changes.
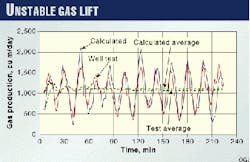
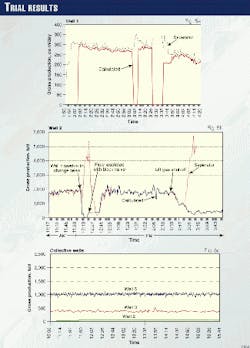
Fig. 2 shows the footprint of an unstable gas-lift well with instrumentation installed at the wellhead. Shell conducted the remote surveillance test along with a traditional well test.
As can be seen, the calculated rate from the remote surveillance data successfully tracks the well test pattern. Average values are also in reasonable agreement.
Wellhead measurements
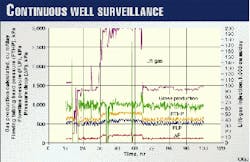
Fig. 3 illustrates another example, from one of Shell's operating units, of the benefits of continuous well surveillance.
The gas-lift injection rate in the well suddenly increased from 90,000 to 200,000 cu m/day (3.2-7.1 MMcfd). This happened when the feedback mechanism on the gas-lift control choke failed and the choke opened completely.
The tubing and flowline pressures both increased discernibly as a result of increased gas production, doubling the differential pressure to about 200 kPa (29 psi).
The calculated gross flow rate automatically compensated for changes in the lift-gas rate and tubing pressure. Doubling the lift-gas rate had no affect on the gross production rate. This is exactly as expected because the well's recent tests, at gas-injection rates of 165,000 and 97,000 cu m/day, produced 947 and 926 cu m/day (5,957 and 5,825 bo/d), respectively. The well produces on the flat portion of the gas-lift performance curve.
Other monitoring methods based solely on tubing pressure or differential pressure would not have given the correct information.
Based on such successful applications, this Shell operating unit adopted continuous well surveillance on all wells at one producing site.
Manifold measurements
One Shell operating unit tested the continuous monitoring system with DP cells at a production manifold. It selected five wells for the test. One well quit, reducing the number to four wells.
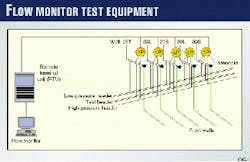
The operating unit installed DP cells on each flowline, across the bean box at the inlet manifold. The cells transmitted DP signals over a wire to an RTU, connected to a PC running monitoring software (Fig. 4).
The rate-vs.-time plot (Fig. 5a) indicates that the test-separator values agree with those estimated by the software. The software accurately tracks changes in production during the test and when the choke bean changes from 52/64 to 48/64 in.
After closing in Well 1, the estimated flow rate went to zero, but the test separator recorded increased flow because of a combination of leaking manifold valves and faulty separator level control that allowed gas to enter the oil flow meter.
Without the continuous surveillance method, these spurious readings could easily be misinterpreted as higher-than-normal production. Clearly, this would yield an invalid well test.
In a second test (Fig. 5b), Shell simulated a dying gas-lift well to determine if the continuous surveillance method would track the corresponding decrease in production.
Lift-gas supply was shut-off and well flow rate decreased as measured by the test separator and the continuous surveillance method. The flow rate dropped from about 1,800 to 700 b/d before the operator observed a sudden rise in the flow rate from the test separator.
Again, this was due to the test separator's inability to maintain liquid level, leading to gas carry-under into the liquid outlet line.
Both the continuous surveillance technique and test-separator values tracked oil flows at rates down to 700 b/d. At lower rates, the test separator's passed gas resulted in spurious meter readings.
The continuous surveillance technique successfully tracked liquid flow down to 700 b/d. At less than 700 b/d, there was no independent measure of liquid flow due to test-separator problems. With diminishing lift-gas flow, however, oil production should continue to fall, and the continuous surveillance technique indicated declining production, as expected.
Shell, essentially, repeated these tests on two additional wells with similar results.
Simultaneous monitoring
Fig. 5c illustrates that changes in one well do not affect other wells. In this case, the operator closed-in Well 1 and progressively opened it up without any observable effects on the other wells.
Shell did not observe any interference at the flow station, caused by either the flow sensor's proximity to the production manifold or by the possible effects of other wells that might mask the performance of the well being monitored.
Therefore, Shell concluded that changes in one well have no adverse effect on other wells at the same manifold. These wells do not appear to interfere with each other.
Technique potentials
Continuous-monitoring techniques in Shell operations are relatively new; hence, not all the benefits have been collated and quantified. Shell, however, sees significant potential in the following areas:
- Safer operations and reduced operating costs because operators visit only wells with problems.
This reduces exposure to hazard and eliminates spurious travel and logistics and unnecessary activities such as well testing and sample taking. This also may reduce the data volumes and make it easier to see significant changes and trends in well behavior.
- Increased production because of early warning and correction of well problems.
- Improved well and reservoir management because of early warnings of well problems and better understanding of well behavior indications of changes in well oil, gas, and water productivity.
These changes may give early warnings in surface and subsurface phenomena and well-health problems. Observation and analysis of real time well "footprints" may lead to a better understanding of well and reservoir behavior.
- Improved allocation accuracy because the allocation can be based on a continuous estimate of well productivity, rather than on discontinuous well tests. Allocation accuracy may also be improved by automatically accounting for periods of low production and off-production and by measuring flows under actual production.
- Improved allocation frequency because the allocation can be automated and hence done as frequently as required.
- Improved planning and deferment tracking by comparing actual well productivity with planned well production, giving the operator an earlier and more-accurate indication of deviation from target and enabling him to take faster corrective action.
Also, planners may obtain more accurate and more timely feedback regarding the viability of targets, leading to more realistic planning.
- Improved well testing because continuous monitoring indicates when a well needs to be tested and also may help with quality control of the well test result by providing a comparative measure of the well productivity. The net effect would be to improve test-separator utilization by only testing wells that really need to be tested.
Another benefit would be improving the quality of the test results by identifying and correcting problems sooner and better. Early identification of well test faults may also reduce the need to retest wells.
- More efficient reservoir operation because of real-time monitoring of total field productivity as the sum of individual well measurements. These data could provide input for real-time field optimization.
Compatibility
Shell's continuous flow monitor system uses low cost, commodity pressure transducers. The transducers may be connected to the flowline with 1/2-in. NPT couplings with isolation valves. Hence, the transducer is not exposed to damaging well fluids and can be easily removed for maintenance or replacement.
Modern DCS and SCADA systems, and associated standards such as Fieldbus, facilitate low-cost applications and transducer automatic calibration and fault detection. Hence, life-cycle costs associated with these transducers are low.
FlowMonitor software is available as an "open" Windows NT module that can be easily dropped into an "open," Microsoft compatible environment.
The upshot of this is that the software can be easily and cost-effectively added to existing Microsoft standard compliant DCS and SCADA systems. The software then unobtrusively co-exists with the DCS or SCADA system.
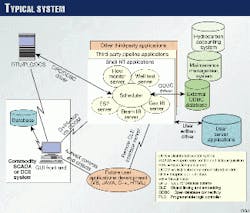
The software reads transducer real-time values from the DCS or SCADA systems and calculates oil, water, and gas flows.
The values are then posted back to the DCS or SCADA database for trending and alarm reporting, using an interface based on OPC (object model for linking and embedding, OLE, for process control) or ODBC (open database connectivity) standards.
Fig. 6 shows the typical system architecture.
Shell originally developed the system as a PC-based application, but it is also being developed to run in a UNIX environment because many current Shell SCADA systems are based on the UNIX operating system.
The Author
Ron Cramer works on project managing and marketing systems for oil field automation and management for Shell Services International, Houston. He previously worked for Union Carbide and Polysar in research and process areas and for Shell International in the areas of oil field automation and production systems.
Cramer has a BS in chemical engineering from Strathclyde University and an MS in chemical engineering from Waterloo University.
Wim der Kinderen works as a consultant production technologist for Shell UK Exploration & Production in Aberdeen. He has worked for Shell since 1984. Kinderen holds a degree in physics from Eindhoven University, The Netherlands.
Nuhu Adaji is head of production technology and of development in the southern swamp team in Warri, Nigeria. He joined Shell Nigeria in 1977. Adaji obtained a BS in mechanical engineering from University of Manchester, U.K.
Chris Onoyovwi is a project engineer with the CAO project team, where he was involved with the low and off field trials at Olomoro. He held various positions in Siemens Nigeria, Mobil Producing Nigeria, Ajaokuta Steel Co., and National Fertilizer Co. of Nigeria.
Onoyovwi has a BS in electronics and electrical engineering from the University of Ife, Nigeria.
Cleon Dunham helps direct oil field automation development for Shell International Exploration & Production B.V. (SIEP) in The Netherlands. Since joining Shell Oil Co. in 1964, he has held various engineering and operations assignments. Dunham has a Bachelor's degree in agricultural engineering from Cornell University.
Paul Rudenko works for Shell UK Exploration & Production in Aberdeen and has introduced the FlowMonitor techniques for subsea wells. He has worked for Shell since 1997. Rudenko holds a degree in aerospace engineering from Delft University of Technology, The Netherlands.
