US gas growth to rely heavily on Canada, Gulf of Mexico
The following article is a summary of the Gas Technology Institute's report, The Long-Term Trends in US Gas Supply and Prices: 2000 Edition of the Gas Research Institute Baseline Projection of US Energy Supply and Demand to 2015.
North American natural gas production grew to near-record levels during the 1990s despite gas prices averaging only one half of the 1980s levels (in real 1998 dollars). While year-to-year fluctuations in gas production are likely, current expectations are that US gas production will continue to set records in the future.
Furthermore, other potential sources of gas supply-not addressed in the 2000 Gas Research Institute (GRI) Baseline Projection, for economic and engineering reasons-could account for even higher levels of gas supply than shown. These sources include:
- Substantial pockets of deep onshore gas bypassed when exploration activity focused on easier-to-reach shallow formations.
- Enhanced recovery from existing fields to levels beyond those anticipated in the 2000 projection.
- Increased LNG imports, which are playing a growing role in world gas trade but currently only a small role in overall US supply.
- Production from the vast gas hydrate resource in the Gulf of Mexico.
The 2000 edition of the GRI baseline projection is consistent with an expectation that both gas demand and supply will continue to grow. Gas supply is anticipated to increase by nearly 50% over the next 15 years, even though real (1998 dollars) gas prices average only $2.20/MMbtu over the projection.
Because the gas resource base in producing locations depletes under fixed-technology conditions, a growing gas supply in a static price environment depends on advances in technology to expand prospective resource areas and reduce production expenses. The 2000 projection assumes that technological improvements will continue at levels consistent with recent historical experience.
Natural gas consumption
Gas markets can be characterized according to their relative sensitivity to gas prices. One designation assigns gas consumption to price-sensitive, operations-driven, and core markets.
Core markets are the residential and commercial end-use sectors, and price-sensitive markets are the industrial, electric power generation, and vehicle end-use sectors as well as gas export markets. The operations-driven market consists of lease gas, plant fuel, and gas used in transmission and distribution.
The core markets are more price-sensitive at the margin (i.e., for new customers or uses) than for existing customers or uses. As a result, sharp increases in gas prices could have a noticeable effect on increased gas sales in core markets, but their effects on existing sales levels would be quite small.
For price-sensitive markets, however, sharp increases in gas prices can reduce both existing gas sales and the rate of growth in gas sales. The operations-driven markets are indirectly affected by price changes tracking US gas production and total gas sales.
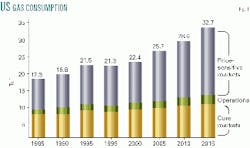
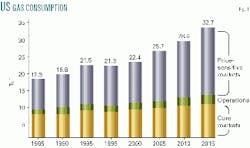
Fig. 1 depicts US gas consumption in these three market categories for selected years during 1985-2015. Most of the increase in gas consumption since 1985 has occurred in the price-sensitive markets. From 1985 through 1998, for example, consumption increased more than 30%, and more than half of that increase was in the price-sensitive markets. This trend is likely to continue in the future; during 1998-2015, almost 75% of increased US consumption will be in the price-sensitive markets. In 2015 alone, 62% of US consumption will be in price-sensitive markets.
Natural gas price
The 2000 baseline projection describes a world in which real oil prices remain flat, while real coal and electricity prices decline. The relatively high gas price levels of 1999 and early 2000 are considered to be transitory and supported by temporary factors, including a tight supply-demand situation due to low drilling levels in 1998, nuclear plant outages, and slow storage fill rates.
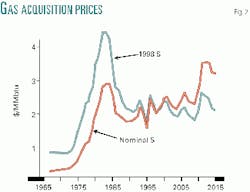
Fig. 2 illustrates historical and projected gas prices, including fluctuations attributable to boom and bust cycles in the exploration and production industry. Real (1998 dollars) gas prices average $2.20/MMbtu, with price spikes of as much as 25%.
Gas prices remained high in 2000 as the low drilling levels resulting from the oil price collapse in 1998 impacted the market. Over the very-near term, gas spot prices could continue to spike significantly in response to extreme weather conditions because supplies are tight. However, with higher oil and gas prices in 1999 and 2000, drilling activity is anticipated to gradually accelerate, improving supply availability.
After 2002, US Lower 48 real prices are expected to soften as growing production from the Gulf of Mexico and rising Canadian imports (both from Alberta and the Maritime Provinces) begin to pressure domestic supply. The general trend in real prices will be down over this period, although there could be some intermittent price cycles.
Real gas-acquisition prices (delivered to the pipeline) are projected to track oscillating wellhead prices, with peaks occurring in 2006 and 2011 and valleys in 2004 and 2009.
The range of extreme price points during the projection period is $1.67/MMbtu at the 2009 low and $2.48/MMbtu at the 2011 peak.
In nominal dollars-the actual price paid for gas in the year purchased-gas acquisition prices are projected to increase to $3.06/MMbtu by 2015 from $1.88/MMbtu in 1998, as depicted by the upper line in Fig. 2.
Nominal prices will spike as high as $3.41 and fall as low as $2.00/MMbtu over this period, never again reaching the 1998 low price.
Stable real gas-acquisition prices in the baseline projection are achieved, not only with flat oil prices and declining coal and electricity prices, but through a robust resource base combined with continued advancements in technology by the gas industry.
Essential to this outlook is the ability of producers to discover new reserves and to quickly connect them to market. The challenges facing the gas industry are significant but far from insurmountable. Short-term equipment shortages, weather extremes, or variability in world oil prices may cause gas prices to fluctuate, but, in the long run, real gas prices will remain stable.
Table 1 shows Lower 48 acquisition prices in the projection for the three general supply categories: Lower 48 production, Canadian imports, and supplemental sources. Average acquisition prices in nominal dollars are also presented.
In the late 1980s and early 1990s, import prices exceeded Lower 48 gas production prices because Canadian gas was in short supply relative to demand. Due to the increasing development of Canadian gas since the mid-1990s and thereafter, Canadian gas prices fall and remain slightly below the US prices throughout the projection.
The lower Canadian gas prices give Canada the opportunity to effectively compete with US production for incremental demand growth in the Lower 48.
During 2000-05, Lower 48 prices are expected to soften as rising Canadian imports (both from Alberta and the Maritime Provinces) and growing production from the Gulf of Mexico combine to satisfy incremental demand growth.
The projection is that real gas acquisition prices will fall to $2.01/MMbtu by 2005 from an average of $2.23/MMbtu in 2000. After 2005, real (1998 dollars) gas prices will gradually decline to $1.94/MMbtu by 2015 as drilling activity accelerates to meet growing gas demand. In nominal terms, acquisition gas prices are projected to increase to $3.06/MMbtu by 2015 from $1.88/MMbtu in 1998.
Crude oil price
GRI uses a commodity approach-a composite of US refiners' acquisition costs for crude oil-as the basis of the expectation for crude oil prices. Under this approach, there are limited prospects for a real-dollar increase in the long-term price trend of a commodity such as crude oil.
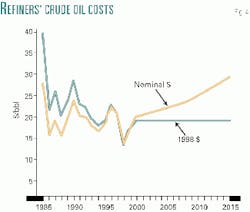
One of the goals of adopting this approach is to better reflect the long-term historical path of prices (essentially flat). A secondary goal is to avoid the constant annual parallel drops and increases in the price path as the change in the base year price is tracked. Crude oil prices developed for the GRI 2000 baseline projection are shown in Table 2.
This is not to imply that prices will not fluctuate monthly or yearly. This type of fluctuation should be expected. One-time political events, some of which may be significant and enduring, or price pressures or weaknesses during strong or weak periods of economic growth, may affect short-term (up to 3 years) prices. However, because of the complex interplay of economic, political, and social decisions on a worldwide scale, it is difficult, if not impossible, to anticipate these short-term events.
Current oil prices are being impacted by the Organization of Petroleum Exporting Countries' efforts to manage production. Because of OPEC actions, world crude oil prices are currently well above a market-based equilibrium price. However, under a commodity approach, it is believed that this effort will prove unsustainable, and quotas will be exceeded in the short term. Once the quotas are surpassed, prices will move towards price equilibrium.
Prior to the OPEC production constraints, the market experienced the opposite side of the commodity cycle. The currency crisis in Asia led to a decline in oil demand and a sharp drop in prices during 1998. On average, during1993-97, Asian oil demand increased by almost 900,000 b/d in each year.
In 1998, demand declined by almost 500,000 b/d, a swing of 1.4 million b/d. As a result of the shortfall in demand, crude oil prices fell to a low of $9.84/bbl (composite US refiners' acquisition cost of crude oil) in December 1998.
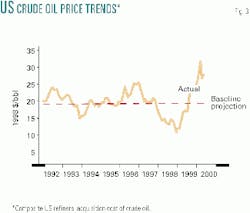
These events do not represent new long-term trends in crude oil prices. They illustrate the impact of one-time events on prices in the short term. These cycles-falling prices in 1998 and rising prices in 1999-are completely consistent with taking a commodity approach towards the outlook for crude oil prices (Fig. 3).
However, the events that precipitated these cycles were unpredictable. None of the events impacting markets in these two periods can be identified as long-term fundamental factors. As a result, GRI has chosen to rely on the historical long-term trend of real crude oil prices as the basis for prices in the long term.
As with most other commodities, real crude oil prices have historically remained flat. If there is any direction to the trend in real crude oil prices, it exhibits a slight downward bias over the long term. Fig. 4 outlines the crude oil prices, in real and nominal dollars, used in the 2000 edition of the projection.
Gas supply outlook
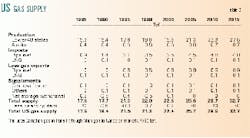
Table 3 summarizes the US gas supply in the 2000 projection at 5-year intervals, including US gas exports. Increased Lower 48 gas production dominates growth in US gas supply. By 2010, Lower 48 gas production is expected to exceed the 1973 peak of 21.5 tcf. The introduction and application of new gas supply technologies makes this new peak in Lower 48 gas production possible. The long-term expansion of Canadian gas production-and the resulting imports-also depends on the availability of new technology.
The growth in Lower 48 gas production reflects predominantly increased supply from high permeability reservoirs, principally in the Gulf of Mexico and onshore reservoirs below 10,000 ft.
The study projects that production from onshore sediments above 10,000 ft will decline during this period. Production from less conventional gas sources, principally low-permeability ("tight") and shale reservoirs, also will play a growing role in meeting supply requirements.
Production from coalbed methane reservoirs will continue to play an important role in meeting future supply requirements. However, increased coalbed production from Wyoming and other areas barely offsets a decline in San Juan basin production. Coalbed production is expected to grow only modestly over time.
The projected growth in nonconventional gas is smaller than in past GRI baseline projections. Abundant gas supplies from the Gulf of Mexico, growing imports, and relatively low gas prices limit nonconventional gas growth.
Pipeline imports, predominantly from Canada, are expected to increase quickly, growing to 4.1 tcf by 2005 from 3.5 tcf in 1998. However, these import figures are somewhat misleading, as they include gas in transit. A portion of Canadian gas imported to the US Midwest is immediately re-exported to Canada and is not available for consumption in US end-use markets. Excluding the gas in transit, net pipeline imports are projected to grow from to 3.7 tcf by 2005 from 3.1 tcf in 1998, still a strong rate of growth.
Pipeline imports accounted for 15% of total US gas supply in 1998. By 2005, imports are expected to account for almost 17% of total US gas supply. Growth in pipeline imports after 2005 is projected to be more gradual, reaching 4.8 tcf by 2015.
With continued US gas supply expansion from other sources, the pipeline-import share of total supplies is expected to decline to 14% by 2015.
Gulf, Canadian supplies
Much was written in the trade press during 1999 about the decline in crude oil prices, the collapse in drilling activity, and the dire consequences for natural gas deliverability.
Some commentators cited statistics illustrating the alarming decline rate in natural gas production, particularly from the more-shallow waters of the Gulf of Mexico, and predicted a worsening drilling slump and impending gas supply shortages.
The most-dire predictions were avoided in 1999 when new offshore deepwater production and increased Canadian imports offset the declines that did occur in mature supply regions.
Although short-term supply problems still occur, the events of 1999 showed how the industry can meet gas supply requirements as demand levels grow.
A 30-tcf future for gas demand is achievable only with continued improvement in technology at rates consistent with recent experience and increased gas industry capital investment in exploration, production, and the expanded infrastructure to deliver gas to customers. This will provide for increased gas supply contributions from all production regions and from all types of gas.
The supply analysis in the 2000 edition of the GRI baseline projection echoes the conclusions listed in the preceding paragraph. However, the projection also highlights the fact that the two key contributors to meeting future US supply requirements will be increased production from the Gulf of Mexico and imports from Canada.
While Lower 48 onshore gas production will continue to play an important role in meeting supply requirements, Gulf of Mexico gas reserves and imports from Canada will play an increasingly important role over time as the US places more and more reliance on these two key supply sources.
Offshore production, reserves balance
The basis for the projected increase in Gulf of Mexico production is increased drilling activity. However, because of the prolific nature of wells in the Gulf of Mexico-an offshore well can add 30 times more to reserves than a typical onshore well-drilling needs to grow steadily but not heroically.
The increase in drilling and the prolific nature of gulf wells means that reserves increase more rapidly than production in the Gulf of Mexico, which allows the absolute level of production to grow over time.
The top section of Fig. 5 shows the historical and projected balance between reserve additions, and the bottom section shows production. The figure illustrates that reserve additions fluctuate consistent with the boom and bust cycles in exploration activity resulting from price movements.
On balance, reserve additions have exceeded production, and this condition is projected to persist in the future and even expand due to contributions from deep and ultradeep reserve additions. This growth in reserves allows production to gradually increase over the projection.
Canadian replacement balance
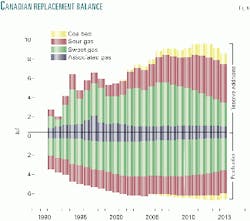
The second pillar of US gas supply is Canadian imports. As is true in the US, Canadian production can increase only if reserve additions exceed production. Fig. 6 illustrates how the different types of reserve additions and production will contribute to supply. Shown are the various sources or types of gas.
For Canada, these include sweet conventional gas, sour tight gas, coalbed methane, and associated gas. Of particular note, associated and sweet gas production is greater than reserve additions in later years. However, sour gas and coalbed methane reserve additions exceed production, providing the ability to not only sustain production but also to increase it.
In fact, Canadian reliance on production from sour gas and coalbed methane increases rapidly in the later years of the projection as sweet and associated gas production begins to decline.
Natural gas production
Gulf of Mexico production is expected to increase to 8.1 tcf by 2015 from 4.9 tcf in 1998. The 3.2 tcfgrowth in production represents the largest single source of incremental gas supply-29% of total supply growth-in the combined US and Canadian markets.
Meanwhile, Canadian production is expected to expand by 2 tcf during 1998-2015 and is the next largest contributor to incremental gas supply, accounting for 18% of new supply. Canadian imports to the US will increase by 1.3 tcf during the projection period.
Because of their locations relative to the key Northeast and Middle Atlantic gas demand markets, these two prolific supply regions will be in continual competition to meet incremental supply requirements. As a result of this competition, supply will swing back and forth between them based on the availability of pipeline capacity and resource economics. However, gas consumers, assured of a steady supply of gas at competitive gas prices, will be the big winners.
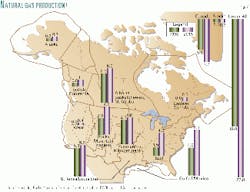
Fig. 7 shows how and where Lower 48 gas production will grow to 27.8 tcf in 2015 from 19.0 tcf in 1998. As previously noted, gas production from the Gulf of Mexico also will grow steadily throughout the forecast to 8.1 tcf in 2015 from 4.9 tcf in 1998.
By 2015, Gulf of Mexico gas production is expected to account for 29% of Lower 48 gas production. Gas production in the Rocky Mountain basins will nearly double over the projection period to 4.9 tcf in 2015 from 2.9 tcf in 1998.
The projection shows the Permian-Midcontinent area exhibiting slow growth as this area increases production to 4.8 tcf in 2015 from 4.3 tcf in 1998. Canada's natural gas production will grow to 7.7 tcf in 2015 from 5.6 tcf in 1998. The Alberta-Saskatchewan-Manitoba region of Western Canada will account for over half of the Canadian growth, with production increasing to 6.0 tcf in 2015 from 5.0 tcf in 1998.
New technology affects gas production throughout the projection. Technology has the most noticeable effect in regions having large volumes of resources that are uneconomic at present but that will become profitable to produce under enhanced recovery methods. These include the low-permeability resource and gas extracted from shale and coal beds. The Rocky Mountain and Appalachian regions are good examples of the effects of technology, but all regions rely on technological advances to maintain competitiveness at projected wellhead prices.
Although not the focus of this report, transmission capacity also remains a major factor affecting supply growth. Growth in transmission capacity is critical for moving additional volumes from Western and Atlantic Canada. It is also essential for moving Gulf of Mexico and Rocky Mountain gas to market.
Gas producers are investing heavily in new gas transmission capacity, and many of the pipeline projects currently in planning or construction stages represent producers' interest in gaining access to growing markets.
The author
John Cochener is principal analyst at the Gas Technology Institute's Baseline Center in Arlington, Va., where he manages gas supply, transmission, and price issues related to the baseline projection. He has extensive oil and gas marketing, production, transportation, processing, and operating experience spanning a 20-plus year career that began with Placid Oil Co. in Dallas. There he was instrumental in marketing activities for the first deepwater Gulf of Mexico production from the Green Canyon area. Cochener has also performed numerous diverse oil and gas assignments worldwide for leading energy consulting firms. He was a member of the gas supply task group and three subgroups for the landmark 1999 National Petroleum Council gas study.
