Canadian CO2 optimal emissions target to cost up to C$1.5 billion
The Canadian government, along with some provincial governments, have set policies to cut methane emissions from 40-45% of baseline value by the year 2025. Baselines might differ between governments, but the overall targeted reductions by Canada are about 25 million tons (Mt) carbon dioxide equivalent (CO2e) of methane emissions by 2025. The optimal reduction scenario achieves this reduction at a total cost of C$0.4-1.5 billion.
The gas supply chain can be broadly divided into upstream, midstream, and downstream sectors, with sources of methane emissions identified, and mitigation technologies assessed, from wellhead to burner-tip. Methane emissions from the sectors can be further grouped into source categories such as fugitives, flared, vented, line-heating, and burner-tip.
In line with the ongoing debate on the economic and environmental impacts of methane emissions from natural gas supply chains, the Canadian Energy Research Institute (CERI) developed a modelling tool, the Integrated CH4 Emission Reduction Model (ICERM), to quantify methane emissions and assess reduction opportunities across the Canadian natural gas supply chain. ICERM has three modules: emission quantification, abatement cost analysis, and optimized selection of mitigation technologies to meet emission reduction targets cost-effectively.
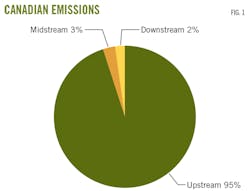
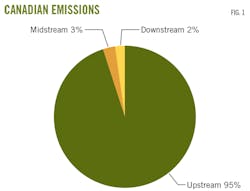
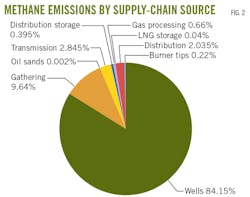
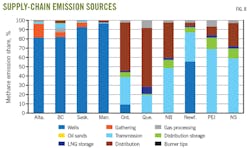
ICERM quantified methane emissions from the Canadian natural gas supply chain in 2017 at 47.5 Mt CO2e. Fig. 1 shows the distribution of emissions across supply chain sectors, while the emission sources are depicted in Fig. 2. Western provinces with more upstream oil and gas activities generate more emissions than eastern provinces where natural gas demand may be high but supplied from other provinces. Alberta contributes more emissions than other provinces, with an estimated total in 2017 of 25.4 Mt CO2e, the upstream sector responsible for as much as 96%. These emissions are mainly from oil and gas wells and gathering sites. The other western provinces (British Columbia, Saskatchewan, and Manitoba) also have higher upstream emission footprints with total estimated values of 3.6, 16.2, and 1.3 Mt CO2e, respectively.
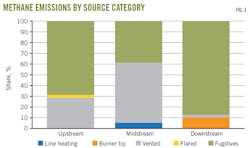
Fig. 3 shows sectoral emissions according to source categories. Both upstream and midstream emissions from producing provinces are primarily of the fugitive and venting categories. Downstream emissions are mostly from the fugitive and burner-tip source categories, representing about 95% of downstream releases in most cases.
The eastern provinces do not have as much upstream oil and gas activity, so their emissions come from midstream and downstream segments of the gas supply chain where either imported gas or Canadian gas from other provinces is transported for distribution to various end-users. As such, gas transmission and distribution systems are the major emissions sources. The bulk of eastern province midstream sector emissions are from fugitive releases and venting activities. In Ontario, fugitive and vented emissions account for over 90% of total midstream emissions. Fugitive and burnertip emissions due to undestroyed hydrocarbons at end-use dominate downstream sector emissions. Fugitive emissions from distribution pipeline and customer metering losses account for about 95% of total downstream emissions.
Applying ICERM
ICERM’s optimization module combines emission quantification and abatement cost data to evaluate emission reduction and economic impacts of various policy scenarios. CERI’s study evaluated three different hypothetical policy scenarios to achieve emission reductions by adopting various combinations of mitigation technologies. These scenarios are:
• Maximum reduction, which evaluated the economic cost and the maximum amount of emission reduction that can be achieved using the mitigation technologies assessed.
• Uniform reduction, which evaluated the economic cost and emission reduction achieved if a 45% reduction target is assigned to each emitting device in the supply chain (except burner-tip emissions).
• Optimal reduction, which identified a cost-effective mitigation pathway to reduce emissions to 45% of 2012 levels as reported by Canada in the National Inventory Report (a scenario created to mimic federal methane regulation).
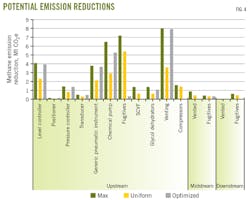
CERI applied these scenarios to the entire Canadian natural gas supply chain, in contrast to existing federal and provincial regulations which place methane emission reduction targets mainly in the upstream sector. Fig. 4 shows methane emission reductions from each supply chain sector and emitting devices for the entire Canadian natural gas supply chain under the three hypothetical policy scenarios.
Achieving the optimal economic scenario requires omitting some of the emission source categories when choosing where mitigation should be deployed. These include emissions from midstream venting, upstream fugitives, compressors, and surface casing vent flow. Optimal emission reduction is calculated from the average of the results obtained using the lower and upper ranges of the abatement costs. This scenario does not arbitrarily specify what emission sources should be controlled but uses linear programming to determine the most cost-effective mitigation to meet expected reduction at both federal and provincial levels.
The reductions in the maximum and uniform scenarios are predominantly from upstream venting, fugitives, and pneumatic pumps. In the optimal scenario, reductions are mainly from upstream venting and pneumatic devices including pumps, controllers, and generic instrumentation.
Fig. 4 allows close comparison of emission reductions from each emission source category under the hypothetical policy scenarios. At the provincial level, optimal (45%) reduction of emissions is based on contributions to total Canadian methane emissions during 2012.
Mitigation of emissions from surface casing vent flow (SCVF) and compressors is not done in the optimal adoption scenario due to its higher abatement costs. Most emission reduction opportunities are identified from pneumatic, venting, and fugitive sources under each mitigation scenario. Also, in line with the distribution of overall emissions across supply chain sectors, the upstream sector is the major source of the emissions where significant mitigation efforts can achieve deeper cuts in emission reductions.
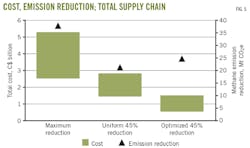
Fig. 5 presents a results summary showing total emission reductions and cost of achieving those reductions under the various abatement analysis scenarios for the entire Canadian natural gas supply chain. Total cost of emissions reduction in the maximum reduction scenario is in the range of C$2.5-5.3 billion ($1.9-4.0 billion), for a total methane emission reduction of about 38 Mt CO2e. For the uniform scenario, the cost is C$1.4-2.8 billion and reduction totals 21 Mt CO2e. The optimal reduction scenario achieves about a 25 Mt CO2e emissions cut at a total cost range of C$0.4-1.5 billion. None of the scenarios include costs of administration, measurement, and reporting which are required by existing methane regulations in Canada.
Canadian federal regulation has a target of 40-45% reduction below 2012 levels by 2025. Canadian national inventory report data indicate that total methane emissions in that baseline year (2012) was 107.5 Mt CO2e, of which about 51% (55 Mt CO2e) was from oil and gas. Therefore, if the regulation covered all sectors of the natural gas supply chain for a reduction target of 45%, that would amount to about 25 Mt CO2e, similar to our optimized reduction scenario.
The federal regulation, however, aims to achieve reductions from the upstream and transmission (midstream) sectors. If the 45% reduction is applied to these components alone, the reduction target would be only slightly below 25 Mt CO2e given that the majority of emissions are from the upstream sector.
Alberta and British Columbia regulations are designed to achieve a reduction in oil and gas methane emissions by 45% below 2014 levels by 2025. Similarly, if both regulations covered the entire natural gas supply chain in their respective provinces, Alberta’s reduction target would be about 14.16 Mt CO2e and British Columbia’s reduction target would be 1.6 Mt CO2e. Relative to the federal regulation with 2012 baseline, the numbers would be 14.2 Mt CO2e and 2.0 Mt CO2e (similar to CERI’s optimized scenario), respectively. But if both provincial regulations aim to achieve their methane emission reductions from the upstream sector alone; the numbers would be only slightly below these values given the dominance of upstream emissions.
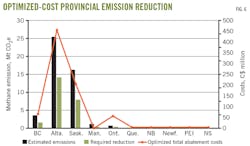
Fig. 6 shows the provincial breakdown of estimated methane emissions, required emission reductions, and total abatement cost for an optimal implementation of emission reduction targets at the 45% reduction below 2012 levels. The estimated total abatement cost for Alberta is C$450 million (2017 dollars), for an emission reduction program focusing on upstream oil and gas emissions in line with current regulation, while costs for British Columbia and Saskatchewan are about C$70 and C$205 million, respectively. In 2017, British Columbia produced 4.98 bcfd of natural gas, while Saskatchewan produced 0.51 bcfd. Saskatchewan generated more emissions than British Columbia over the same year due to a larger number of oil production activities from which associated gas is emitted from upstream infrastructure.
The small number of source categories available in Ontario’s midstream and downstream supply chains, from which most emissions in the province emanate, prevents optimization of mitigation options. The 45% reduction in the optimized mitigation strategy applies to the provincial contribution to overall Canadian methane emissions in the baseline year. Given the fewer source categories for Ontario’s emissions, the emission sources to be mitigated in both the uniform and optimized reduction scenarios are essentially the same. Hence, the abatement costs are also the same. The uniform (45%) emission reduction scenario’s total abatement cost, therefore, of C$55 million is applied to Ontario. Moreover, the current model does not account for upstream impacts of US gas imports into Ontario in 2017.
CERI acknowledges that more accurate data for modelling will become available as new field measurements are reported. Future versions of ICERM will incorporate updated data to improve result accuracy.
Emission quantification
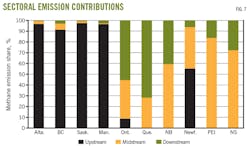
Figs. 7-8 show the emission quantification results for each province, indicating the shares of overall emissions at each sector of the natural gas supply chain and the emission sources contributing the total emissions, respectively. Western provinces with significant upstream oil and gas activities generate more emissions than eastern provinces where natural gas demand may be appreciable but production is not local.
Alberta contributes more emissions than other provinces with an estimated total in 2017 of about 25.4 Mt CO2e, of which the upstream sector is responsible for up to 96%. These emissions are mainly from oil and gas wells and gathering sites. The other western provinces—British Columbia, Saskatchewan and Manitoba—also have higher upstream emission footprints with total estimated values of 3.6, 16.2, and 1.3 Mt CO2e, respectively. Both upstream and midstream emissions from producing provinces are primarily of the fugitive and venting categories. Downstream emissions are mostly from fugitive and burner-tip sources, which represent about 95% of downstream releases in most cases.
Eastern provinces do not have as much upstream oil and gas activity, so their emissions come from the midstream and downstream sectors of the gas supply chain where either imported gas or Canadian gas from other provinces is transported for distribution to various end-users. As such, gas transmission and distribution emissions are the major sources. In these areas, midstream sector emissions are from fugitive sources and venting activities. In Ontario, fugitive and vented emissions accounted for more than 90% of total midstream emissions.
Fugitive and burner-tip emissions due to undestroyed hydrocarbons at end-use dominate downstream sector emissions. The fugitive emissions are often from distribution pipelines and customer metering losses.
Fig. 3 show overall Canadian sectoral emissions according to source categories. Both upstream and midstream emissions from producing provinces are primarily of the fugitive and venting categories. The downstream emissions are mostly from fugitive and burner-tip sources. Considering most of the gas produced in Western Canada is consumed in higher population areas in the east, overall supply chain emissions could be reallocated on a demand basis.
Table 1 shows the distribution of natural gas demand among Canadian provinces. Alberta and Ontario are the major demand centers for Canadian gas. Alberta’s demand is driven mainly by electricity and oil sands operations’ steam requirements, whereas Ontario’s demand is for space, water heating, and manufacturing (petrochemical) use.
Figs. 1-2 show the distribution of emissions on an overall Canadian basis for 2017. Due to the predominant influence of Alberta’s emissions, upstream sources still account for the majority of emissions to the tune of 95% from oil and gas wells and gathering stations. Total estimated Canadian gas supply chain emissions for the reference year (2017) were 47.5 Mt CO2e. This dominance of upstream emissions accounts for the current upstream oil and gas focus of methane emissions reduction regulations by federal and provincial governments.
On this reallocation basis, Ontario and Quebec would be considered major contributors to Canadian gas supply chain emissions, with a combined 2017 impact of 13.6 Mt CO2e. Alberta, however, remains the highest emitter at a total of 23.8 Mt CO2e.
Relative to total natural gas production that year, total emissions amount to an overall loss of about 1.5% from the entire gas supply chain. Studies have estimated that a net environmental benefit of natural gas over coal is maintained when total losses from natural gas systems do not exceed 3% of total production for a 20-year horizon global warming potential (GWP) or 10% for a 100-year horizon GWP (see accompanying box for explanation of GWP).1 Given that our model uses various reported measurement data, however, it could be argued that the upper limit of estimated loss should be 3.5% of the total gas production. Recent analyses have bound the error in fugitive emission estimates to within -16% to 34%.2
Abatement cost estimates
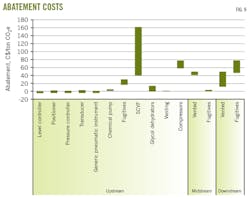
Fig. 9 shows the abatement cost for emission reduction from the source categories in the gas supply chain using identified mitigation technologies. Leak detection and repair (LDAR) implementation is assumed to be performed on a triannual survey basis by the operators (internal inspection) at 60% detection probability. Abatement costs are presented for control of fugitive emissions in each of the three sectors of the network. The range of each estimate depends on the variety of mitigation technologies deployable to each emitting source category and the differences in individual technology vendor and services pricing.
Capital expenditures (CAPEX), operating expenditures (OPEX), and value of conserved gas over the lifetime of a technology provide the basis for calculating costs. The venting source category refers to non-routine venting, whereas routine venting is presented in terms of the emitting device. Abatement costs of upstream LDAR are $17-30/tonne CO2e. Midstream fugitives are less diffuse with fewer sources than either upstream or downstream since they only occur at specific points along transmission pipeline systems. Midstream cost is about $4/tonne CO2e, whereas downstream cost is $47-78/tonne CO2e.
Pneumatic devices have the lowest mitigation costs, and in most cases have negative values which indicate net profitability to replace high-bleeding pneumatic systems with lower or zero-emission ones and control losses of natural gas from those systems. The abatement costs for pneumatic devices range between -$4 and $5/tonne CO2e. Highest abatement costs are for upstream and downstream fugitives, compressors, and surface casing vent flow (SCVF) emissions. Venting is mainly in the midstream segment due to releases at compressor stations and undestroyed methane at stationary line heaters. CERI used actual Canadian field data on hydrocarbon conversion efficiencies at each segment of the supply chain to account for undestroyed methane.
Analysis
ICERM estimated total methane emissions from the Canadian natural gas supply chain in 2017 to be 47.5 Mt CO2e using a methane global warming potential (GWP) value of 25, which is generally adopted by Canadian organizations and governments. Using the most recent 100-year methane GWP upper estimate of 36, total emissions amount to 68.4 Mt CO2e. Most of these emissions arise from upstream oil and gas sector activities related to venting (routine and non-routine) and fugitive sources. The sources of methane emissions were identified and quantified using the combinations of emission and activity factors along with mass balances to account for gas flows during 2017. Abatement cost analyses were also performed on a net basis using cost (CAPEX and OPEX) of mitigation technologies and the economic value of avoided emissions based on the average Alberta Energy Co. gas price in 2017 of $2.25/gigajoule.
An overview of emission source categories with promise for cost-effective abatement points to upstream operations, in which transitions from higher-bleed to lower or zero-emission pneumatic devices and integrated LDAR programs will reduce emissions. This observation supports current federal and provincial methane emission regulations’ focus on meeting reduction targets via the upstream sector.
Although federal regulations target oil and gas methane emissions reductions from the upstream through transmission, Alberta, Saskatchewan, and British Columbia’s regulations focus only on the upstream sector (excluding oil sands). Current regulations, however, must clarify the requirements and conditions for detection, measurement, and monitoring of fugitive methane emissions.
Fugitive emissions are known to be the most unpredictable source of methane releases from natural gas systems. LDAR is the commonly accepted method to control these emissions. There is, however, no single suitable LDAR solution to all fugitive emission problems in the gas supply chain. Regulations will require the right blend of specificities and flexibilities to accommodate variabilities in the characteristics of emissions from different source categories, geographical regions, and seasons.
Among the policy measures proposed for effective methane emission mitigation are:
• Coordinated measurement, monitoring, reporting, control, and verification.
• Performance targets.
• Policy mechanisms that account for regional and temporal variations.
• Technology-blind regulations to drive cost-effective mitigation.
• Integrated implementation framework in synergy with other greenhouse gas mitigation policies.
Recent regulations enacted by the federal government to control methane emissions will impact Canadian upstream oil and gas. Most of the impacted sites are in British Columbia, Alberta, and Saskatchewan. The Canadian government has stated that unless provincial regulations achieve equal or more conservative emissions reductions than federal ones, the provinces will be required to conform to the proposed federal regulations. The Saskatchewan, Alberta, and British Columbia governments have introduced regulations, but more detail is needed on how any mitigation strategies proposed as part of them will yield the desired results, and how these would be assessed and verified in the face of data handicaps for both system operators and regulators.
Studies are underway addressing some of the data and quantification methodology issues limiting understanding of the economic and environmental impacts of gas supply chain emissions. In Canada, the Fugitive Emissions Management Program Effectiveness Assessment is one such study, a collaborative effort by the Petroleum Technology Alliance Canada, the Canadian Association of Petroleum Producers, and the Explorers and Producers Association of Canada. Such programs and other regulatory requirements on emission measurement, monitoring, and reporting are expected to provide new field data and additional insights.
References
1. Barkley, Z.R., Lauvaux, T., Davis, K.J., Deng, A., Miles, N.L., Richardson, S.J., Cao, Y., Sweeney, C., Karion, A. Smith, M., and Kort, E.A., “Quantifying methane emissions from natural gas production in north-eastern Pennsylvania,” Atmospheric Chemistry and Physics, Vol. 17, No. 22, Nov. 23, 2017, pp. 13941-13966.
2. Ravikuma, A.P., Wang, J.F., and Brandt, A.R., “Are Optical Gas Imaging Technologies Effective for Methane Leak Detection?” Environmental Science & Technology, Vol. 51, No. 1, Nov. 29, 2016, pp. 718-724.
Adapted from Canadian National Research Institute Study No. 177, “Economic and Environmental Impacts of Methane Emissions Reduction in the Natural Gas Supply Chain,” January 2019.
Understanding Global Warming Potentials
Greenhouse gases (GHGs) warm the earth by absorbing energy and slowing the rate at which the energy escapes to space; they act like a blanket insulating the earth. Different GHGs can have different effects on the earth’s warming. Two key ways in which these gases differ from each other are their ability to absorb energy (their radiative efficiency), and how long they stay in the atmosphere (also known as their “lifetime”).
The Global Warming Potential (GWP) allows comparisons of the global warming impacts of different gases. Specifically, it is a measure of how much energy the emissions of 1 ton of a gas will absorb over a given time, relative to the emissions of 1 ton of carbon dioxide (CO2). The larger the GWP, the more that a given gas warms the earth compared to CO2 over that period. The time usually used for GWPs is 100 years. GWPs provide a common unit of measure, allowing analysts to add up emissions estimates of different gases (e.g., to compile a national GHG inventory), and policymakers to compare emissions reduction opportunities across sectors and gases.
• CO2, by definition, has a GWP of 1 regardless of the time period used, because it is the reference. CO2 remains in the climate system for a very long time: CO2 emissions cause increases in atmospheric concentrations of CO2 that will last thousands of years.
• Methane (CH4) has an estimated GWP of 28–36 over 100 years. CH4 emitted today lasts about a decade on average, much less time than CO2. But CH4 also absorbs much more energy than CO2. The net effect of the shorter lifetime and higher energy absorption is reflected in the GWP. The CH4 GWP also accounts for some indirect effects, such as the fact that CH4 is a precursor to ozone, and ozone is itself a GHG.
• Nitrous Oxide (N2O) has a GWP 265–298 times that of CO2 for a 100-year timescale. N2O emitted today remains in the atmosphere for more than 100 years, on average.
• Chlorofluorocarbons (CFCs), hydrofluorocarbons (HFCs), hydrochlorofluorocarbons (HCFCs), perfluorocarbons (PFCs), and sulfur hexafluoride (SF6) are sometimes called high-GWP gases because, for a given amount of mass, they trap substantially more heat than CO2. The GWPs for these gases can be in the thousands or tens of thousands.
Source: US Environmental Protection Agency
