Method yields more conservative estimates of DRA effectiveness
Nazar Al-Nasr Abbas Al-Hashim Hassan Al-Saiood
Mustang-HDP
Al-Khobar, Saudi Arabia
Drag-reducing additives (DRA) alone are not enough to meet increased flow demand given pipeline codes and operational constraints, despite being a very practical means of resolving bottleneck situations in pipeline operations, such as increasing pipeline flow capacity to meet peak demand or mitigating potential surges (OGJ, April 4, 2016, pp. 76-78).
A simple method is proposed to estimate DRA-induced flow increase in liquid pipelines from either a field test or the vendor's DRA performance curve. The proposed method requires knowledge of only three operational parameters-average flow rate, pipeline inlet pressure, and pipeline outlet pressure- and could give more conservative results than the vendor's claimed results.
Background
Drag-reducing additives or drag-reducing agents (DRA) are long-chain polymers of very high molecular weight made of alpha olefins.1 Recent developments in DRA synthesis and trials show promising results in terms of reducing frictional losses and improving flow in both multiphase2 flows and gas pipelines, joining DRA's well-established effects in single liquid-phase flows such as stabilized crude or refined products.
DRA manufacturers and vendors present a performance curve with each of their DRA products in a specific application to show its performance in, for instance, oil-service pipelines or other hydrocarbon-service pipelines (e.g., diesel or gasoline).3 Such curves are generated from either laboratory and research tests or from actual field trials in operating pipelines.
These performance curves, however, cannot be generalized to every pipeline, even those in the same type of service. Actual DRA performance curves depend not only on the properties of the DRA and of the fluid into which it is injected, but also on the pipeline's profile and operating conditions.
In most DRA field tests, however, flow rate during normal operation is almost constant and cannot be increased due to operational constraints or demand limitations, despite the desire to measure the percentage flow increase caused by the DRA. DRA performance monitoring measures a pipeline's pressure differential before and after DRA injection. Drag reduction percentages are calculated from these measurements and plotted against DRA concentrations (ppm), generating the actual performance curve of that specific DRA in that specific pipeline and application.
Jet-fuel pipelines cannot use DRA and it is injected only with extreme care into multi-products pipelines shipping batches of jet along with other refined products. Another limitation is the maximum DRA concentration set by the end-user. Some pipeline operating companies set a maximum of 15 ppm of DRA in gasoline to avoid probable plugging of engines' injector nozzles.
Other limitations may come from the pipeline itself, such as multiple fittings, which sharply degrade the DRA and limit its effect. Such degradation could be compensated for by increasing DRA doses, but these are capped both by users' policies and by DRA's own pressure reduction limits.
Increase estimation
Equations 1 and 2 supply the general flow (Q) and pressure drop (∆P) relation across a valve.4 Pipeline topography and fittings (such as elbows) can be substituted for with equivalent lengths, resulting in a horizontal pipe of more or less the actual pipe length between pipe inlet and pipe outlet. Considering this pipe as if it is composed of n-adjacent similar valves of the same size and valve coefficient and applying Equation 2 yields:
• Q²=K2(∆P)1; (∆P)1=Pi-P2, where Pi is pipe inlet pressure.
• Q²=K2(∆P)2; (∆P)2=P2-P3, where P2 is upstream pressure of the second (next) valve
• Q²=K2(∆P)3; (∆P)3=P3-P4, where P3 is upstream pressure of the third valve
Continue until the last (nth) hypothesized valve. Q²=K2 (∆P)n; (∆P)n=Pn-Po, where Pn is upstream pressure of the nth (last) valve and Po is the pipe outlet pressure, the downstream pressure of the nth valve at the pipeline outlet.
Completing these equations yields Equations 3-5
Substituting into Equation 5 produces Equation 6.
The required pipeline inlet pressure after DRA injection (Pia) will be less than the required pressure before DRA injection (Pib) to pump the same flow rate. That is: PiaQ is the same during the test before and after DRA injection, while (∆P)a<(∆P)b, so the proportionality constant after DRA injection Ca must be bigger than Cb, as if we have the same flow going through a bigger valve (Equation 8).
To actually increase the flow rate, we would use DRA with the original available pipeline inlet pressure Pib. That is, we would have to apply the proportionality constant given by Equation 8 into Equation 6, where the new flow rate with DRA would then be as derived by Equation 9, which in turn yields Equation 10.
The predicted flow rate as a result of using DRA would be xQ, where x is calculated from Equation 10 and Q is the original flow rate of the test. Equation 11 shows the percentage of flow increase stemming from DRA use.
The customer can also estimate the flow increase from the drag reduction corresponding to a specific DRA concentration and injection flow rate by letting D equal the fraction of drag reduction resulting from use of DRA (Equation 12). Equation 12 can be converted to Equation 13.
Using Equation 13, Equation 10 becomes Equation 14. The predicted new increased flow rate after using DRA therefore can be estimated from the vendor-provided drag reduction (Equation 15). Similarly, the percentage of flow increase in terms of drag reduction is defined by Equation 16.
During field tests a variable such as the flow rate or pipeline outlet pressure might be hard to keep fixed at a constant value and would fluctuate around an average value during a reasonably stable operation. This average is the datum to apply in the preceding equations.
The DRA performance curve is constructed against a specific fixed flow rate, Q, which can be taken as the average operationally stable flow rate during DRA field testing. If during the development of the DRA curve the flow rate deviated significantly from Q to a new flow rate, Qd, after DRA injection, with a corresponding differential pressure (∆Pd), then ∆Pd will have to be corrected (to ∆Pc) to correspond with Q, not Qd. This can be done as shown in Equations 17-18 given shared pipeline size and fluid properties.5
Substituting ∆Pc into Equation 12 calculates drag as shown in Equation 19. Some DRA testers assume ∆Pc=(Q/Qd)n(∆Pd), where n is a positive real value (does not have to be an integer) that will have to empirically be calculated from two different recorded flow rates, say Q1 and Q2, with their corresponding differential pressures (frictional pressure drops) ∆P1 and ∆P2 (Equations 20-21).
The n found in Equation 21 must equal 2 for Equation 18 to be good for any liquid fluid, with pipeline size and liquid properties assumed constant throughout the test.
DRA limitations
The following case study demonstrates DRA limitations in increasing pipeline flow rate as well as providing examples of flow increase estimations using the suggested formulas.
A 16-in. OD ANSI 600 class pipeline transports 70,000 b/d of diesel 360 km to a storage without DRA. A sharp increase in demand required raising the flow rate to 200,000 b/d by some combination of DRA and a new intermediate pump station under the operational constraint that pipeline inlet pressure must not exceed 1,350 psig.
Fig. 1 shows the pipeline profile at 71,000 b/d without DRA and limited to 1,350 psig. The following options were considered to determine the best alternative.
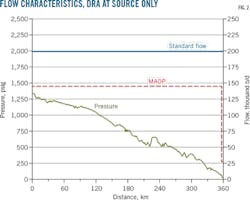
• Source-only DRA. Applying Equation 15, 200=70/√[1/(1-D)], or D=0.8775. This value is very close to the 0.90 value obtained from simulation (Fig. 2). This option requires a very high DRA dosage-500 gal/d, or almost 60 ppm DRA solution or 15.6 ppm DRA polymer-and drag reduction of almost 90%.
Though this is theoretically achievable according to the DRA performance curve, it is not viable due to the roughly 70% drag degradation the DRA will have suffered by KM-160 due to pipe fittings and sharp turns at this location. This situation suggests either installing another DRA injection point downstream of KM-160 or building an intermediate pump station (IPS) at KM-160.
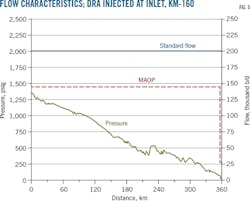
• DRA at source and KM-160. Figs. 3-5 show the pipeline flow-pressure profile at 200,000 b/d and DRA concentration-drag reduction as a result of injecting 200 gal/d of DRA at the source and 150 gal/d at KM-160, downstream of valves and fittings causing the 70% drag degradation. DRA dosage at the two locations totals 350 gal/d (50 ppm, about 25 ppm at each location), less than the amount used when injecting at just the source.
But the DRA-required drag reduction remains very high at almost 85%, which is both hard to achieve practically and very close to the 0.8775 theoretically predicted drag calculated using Equation 13.
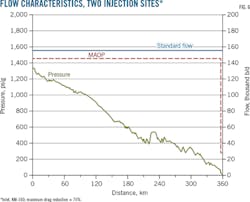
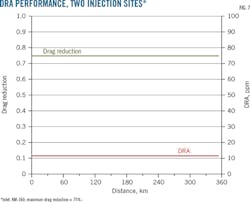
If DRA is injected at these two locations and limited by a maximum drag reduction of 75%, then the maximum achievable flow rate would be 156,000 b/d (Fig. 6-7). The DRA consumption in this case would be 75 gal/d at the source and 53 gal/d at KM-160, a total daily consumption of 128 gal/d (23 ppm).
Substituting the drag value of 75% (i.e. D = 0.75) into Equation 13 predicts a flow rate (xQ, where Q=70,000 b/d) of 140,000 b/d, more conservative than the 156,000-b/d flow rate predicted by simulation based on the vendor's DRA-performance curve.
Neither this nor the preceding option, therefore, can achieve the target flow rate of 200,000 b/d, suggesting the need for an intermediate pump station (IPS) at KM-160, downstream of the bottleneck area.
• IPS at KM-160 without DRA. The maximum achievable flow rate using and IPS but no DRA is 102,000 b/d (Fig. 8), suggesting the need to use both.
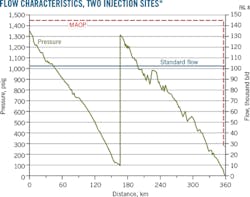
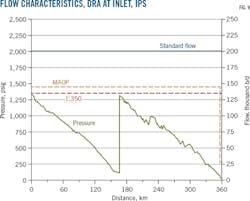
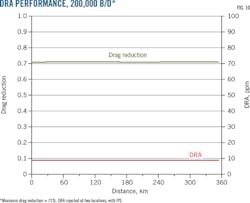
• DRA at both sites, IPS at KM-160. Installing an IPS at KM-160 and injecting DRA both at the source and downstream of the IPS can achieve the target flow rate of 200,000 b/d without exceeding 75% drag reduction. The required DRA consumption in this case would be 75 gal/d (9 ppm) at each site. Figs. 9 and 10 respectively show the pipeline flow-pressure profile at 200,000 b/d and DRA ppm-drag. Drag reduction is about 71%.
The predicted drag of 71% (0.71) is very close to the theoretically calculated drag from Equation 13, where xQ=200,000 b/d and Q=102,000 b/d, from which D=0.74 (74%).
References
1. Al-Nasr, N., "Evaluation of Pipeline Drag Reducing Agent (DRA)," P&CSD Newsletter, Saudi Aramco, 2008.
2. Jubran, B.A., Zurigat, Y., and Goosen, M.F.A., "Drag reducing Agents in Multiphase Flow Pipelines: Recent Trends and Future Needs," Petroleum Science and Technology Journal, Feb. 14, 2007.
3. Murenz, D., "Pipeline Drag Reduction Technology," Oil and Gas Pipelines in the Middle East, Abu Dhabi, May 20-23, 2012.
4. "Flow of Fluids Through Valves, Fittings and Pipe," Crane Co., New York, NY, 1988
5. Menon, E.S., "Liquid Pipeline Hydraulics," Marcel Dekker, Inc., Monticello, NY, 2004.
The authors
Nazar Al-Nasr ([email protected]) is surge analysis consultant in the process department, Mustang-HDP, Al-Khobar, Saudi Arabia. He also served for 6 years as a mathematics instructor and assistant professor at King Fahd University of Petroleum & Minerals (KFUPM), Dhahran, and for 27 years with Saudi Arabian Oil Co. (Saudi Aramco) in pipeline hydraulics and surge analysis simulation. He holds a PhD in mathematics from Clarkson University, Potsdam, NY. He is a member of the American Mathematical Society and of Saudi Council of Engineers.
Abbas Al-Hashim ([email protected]) is a process engineer for Mustang-HDP, Al-Khobar. He has also worked as a process engineer for Mustang in Houston. He holds a BS in chemical engineering technology from Jubail Industrial College, Eastern Province, Saudi Arabia. He is a member of Saudi Council of Engineers.
Hassan Al-Saiood ([email protected]) is a technical support engineer at Pall Corp. He previously worked for Mustang-HDP doing process and pipeline design for both Saudi Aramco and Saudi Arabian Basic Industries Co. He holds a BS in chemical engineering technology from Jubail Industrial College, Saudi Arabia.
More Oil & Gas Journal Current Issue Articles
More Oil & Gas Journal Archives Issue Articles
View Oil and Gas Articles on PennEnergy.com


