P. 5 ~ Continued - LOUISIANA HAYNESVILLE SHALE—1: Characteristics, production potential of Haynesville shale wells described
Displaying 5/6
View Article as Single page
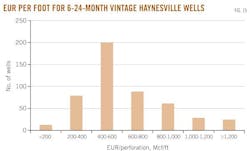
EUR per foot distribution
Lateral length affects production rates and recovery. It might be expected, for example, that a 4,000 ft lateral with 12 stages of fracturing will produce about twice as much as a 2,000 ft lateral with 6 stages, for all other things equal.
We apply the expression EUR/FT to express the ultimate recovery per foot of lateral length. EUR units are in thousand cubic feet. Lateral length is calculated as the distance between the most distal and proximal perforations of the wellbore.
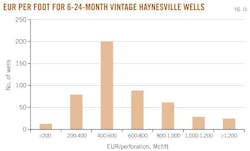
The distribution of EUR/FT is depicted in Fig. 15. The metric provides a quick assessment of production potential and economics and has been used to book proved undeveloped reserves.15
Production forecast
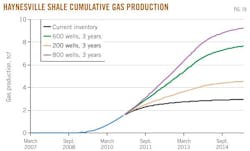
Current inventory
P10, P50, and P90 production profiles are used with a count of the total number of wells completed to project future production from the current inventory. The results are shown in Figs. 16 and 17.
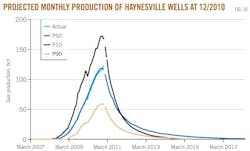
With no additional investment and no new drilling, annual production will decline and the cumulative curves will inflect and begin to converge to their expected cumulative production levels. The expected cumulative production based on P50 wells is 3 tcf. Under the P10 scenario, cumulative production may achieve 3.8 tcf; for the P90 scenario, production is expected to reach 1.3 tcf.
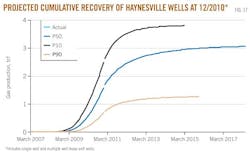
The message of Fig. 16 is clear. Unless new wells are continually brought on stream, Haynesville production will drop off immediately and rapidly.
Operators manage drilling programs based on capital budget constraints, current and expected future gas prices, and the need to hold acreage. The ability to bring on production quickly and reliably in a factory-like mode is an advantage in shale plays, but low price environments and high drilling cost represent constraining factors in profitability.
Drilling scenarios
We illustrate the expected impact of drilling activity on shale gas production using three drilling scenarios ranging from 200 wells/year to 600 wells/year to 800 wells/year for the next 3 years.
We assume future wells will follow P50 production paths described by wells 6-24 months old, a constant level of drilling activity for each of the next 3 years, and no pipeline infrastructure constraints. Prices are assumed to be maintained at a level where there is no significant production curtailment, believed to range between $4 and $5/Mcf.
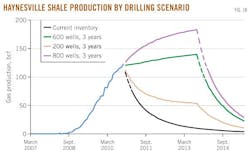
Under these assumptions, three production forecasts depict a cumulative build out ranging between 3 and 9 tcf by September 2015 (Figs. 18 and 19).