P. 2 ~ Continued - LOUISIANA HAYNESVILLE SHALE—1: Characteristics, production potential of Haynesville shale wells described

Displaying 2/6
View Article as Single page
Well statistics
Data source
The Louisiana Department of Natural Resources maintains drilling data in the SONRIS system and identifies separately Haynesville wells.6
Data on drilling activity include spud date, location, field name, lease type, operator, vertical depth, measured depth, perforation interval, and other physical features of the well construction (e.g., tubing size, casing size) and test data (e.g., production, pressure, choke size).
Additional information on drilling and completion activities is based on scout sheets. Production activity is reported monthly in terms of lease unit well (LUW) administrative codes. Single-well LUWs involve one well product streams; multiple-well LUWs report aggregate production based on more than one well.
Production growth
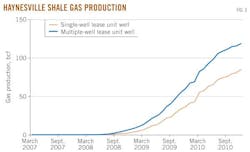
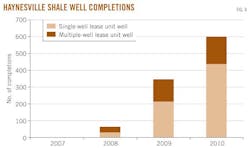
Haynesville shale gas production by single-well and multiple-well LUW is shown in Fig. 3. The majority of production arises from single-well LUWs. There have been 1,052 shale gas completions through December 2010 with 683 single-well LUWs and 234 multiple-well LUWs (Fig. 4).
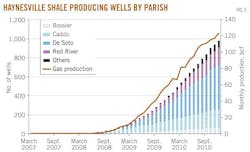
The growth in gas production is a direct result of the large number of new wells that have been brought into production in DeSoto, Caddo, and Red River parishes (Fig. 5). Well completions track production trends closely because the play is still in the early stages of development and marginal inventories are small. As production matures and wells age, the correlation between the number of active wells and production will begin to diverge.
Well configuration
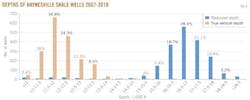
To date, 75% of Haynesville wells have been drilled to 11,000 to 12,500 ft TVD and 20% of wells have been drilled between 12,500 to 14,000 ft TVD (Fig. 6). The measured depth of most wells ranges between 16,000 to 18,000 ft, indicating the high deviation and horizontal displacement of well trajectories.
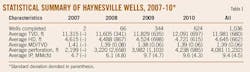
Average vertical depth of well construction has increased to 12,091 ft in 2010 from 11,605 ft in 2008 as the core areas of the play have become established (Table 1).
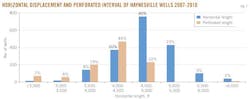
Over 80% of Haynesville wells have a horizontal displacement between 4,000 ft and 5,500 ft and a perforated interval of 3,500 ft and 5,000 ft (Fig. 7). Variation in horizontal displacement and perforated interval is large and reflects differences in completion strategies among operators. Perforation length is the most variable of all well parameters and is an important element in design since it is a key factor in the tradeoff between revenue and cost.
Initial production
Initial production (IP) is an indicator of deliverability and is a standard measure of well quality.
We normalize and report on a daily basis IP rates by well vintage. The average IP for all wells that started producing in 2008 was 6.1 MMcfd; in 2009-10, average IP rates increased to 9.7 MMcfd (Table 1).
Many factors contribute to well productivity, including the depth, thickness, and lateral extent of the shale; organic richness; thermal maturation; permeability and pore pressure; stimulation success; and completion strategy (e.g., perforated interval, number of frac stages, and proppant volume).
Displaying 2/6
View Article as Single page