Price collapse slows midstream operators' 5-year growth streak
Dan Lippe
Petral Consulting Co.
Houston
While this price rebound may appear illogical, a rally often occurs after prices have fallen sharply during the first leg of a bear market. Unsurprisingly, then, after the rebound ran its course, WTI prices continued to fall to a 1-day low of $27/bbl in mid-February 2016.
After a lag of 6-8 months, US crude production finally responded to the accelerating decline in the oil-directed rig count, which fell 567 units (140%) from February to March 2015, according to Baker Hughes. After staging a short recovery in July-August 2015, the rig count began to decline steadily from September to average only 384 by March 2016, or 41% lower than the May-September 2015 average of 654.
While Petral Consulting Co. (PCC) accurately concluded at the time that US oil exploration companies eliminated all drilling activity in marginal areas of various plays and basins, drilling continued in sweet spots such as West Texas and the Bakken shale to account for the slow and uneven shift from rising to declining overall production.
As US crude oil production continues to fall during 2016 and 2017, the concurrent drop in associated natural gas volumes-the basis for US NGL output in the most important producing regions of West Texas, Kansas-Oklahoma, and the Rocky Mountains-will drive a decline in gas-plant NGL production.
From the perspective of US midstream infrastructure operators, however, an imminent surge in ethane demand before yearend 2016 will position it as a crucial element of international NGL trade, prompting immediate requirements for increased ethane recovery.
NGL raw-mix production
Gas-plant NGL production is the primary driver for most of the midstream industry's infrastructure expansion projects. Growth in crude oil production and resulting increases in associated gas production have been, and will remain, the primary drivers of gas-plant NGL production trends.
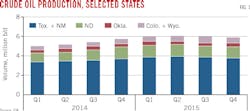
Statistics from the US Energy Information Administration (EIA) showed year-on-year growth in US crude production of 1.30 million b/d in fourth-quarter 2014 but 1.26 million b/d in first-quarter 2015 and 0.99 million b/d in the second quarter (Fig. 1). Slowing growth rates for US crude oil production shifted to outright declining production in first-quarter 2016. PCC estimates US production for the first quarter was 9.08 million b/d, or 0.23 million b/d less than in first-quarter 2015.
Table 1 summarizes quarterly trends in US crude oil production.
PCC estimates associated gas production in the six core states (Texas, New Mexico, Kansas, Oklahoma, Wyoming, and Colorado) during first-half 2015 increased to 13.4 bcfd from 12.3 bcfd in second-half 2014. Associated gas production remained constant at 13.4-13.5 bcfd in second-half 2015, but PCC forecasts production will fall to 12.5-12.7 bcfd in 2016.
Regional trends
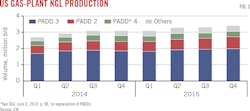
US gas plant NGL production continued to increase in second-half 2015. In third-quarter 2015, gas-plant NGL production rose to 3.32 million b/d, or 225,100 b/d higher compared with the same quarter in 2014, according to EIA data. During fourth-quarter 2015, production volumes increased to 3.41 million b/d, or 306,000 b/d more than in fourth-quarter 2014.
Changes in ethane rejection, however, have significant impact on annual growth in US NGL volumes, and trends in propane+ production provide a clearer view of year-over-year growth in NGL output.
Production of propane+ in third-quarter 2015 grew by 227,100 b/d from the same period a year earlier to 2.23 million b/d but fell to 2.22 million b/d in fourth-quarter 2015, which was down by 189,800 b/d from the final quarter of 2014 (Table 2).
NGL production from new gas plants in eastern Ohio's Utica shale during second-half 2015 contributed to substantial growth in overall US Midcontinent production. Production from gas plants in the eastern Upper Midwest was 163,200 b/d in third-quarter 2015, or 12,100 b/d higher from the same quarter in 2014, according to EIA data. During fourth-quarter 2015, production increased to 195,600 b/d for a year-over-year increase of 45,500 b/d. Ethane rejection limited growth in overall NGL production in third-quarter 2015 but contributed to stronger growth in the fourth quarter.
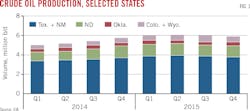
Excluding rising ethane production, NGL production from gas plants in the Marcellus shale remained nearly flat in second-half 2015 compared with the first 6 months of the year. Production was 201,600 b/d in third-quarter 2015 and 195,300 b/d in the fourth quarter, according to EIA (Fig. 2).
Ethane rejection, NGL raw mix production
Spot prices for purity ethane and ethane-propane mix in Mont Belvieu, Tex., during third-quarter 2015 remained well below levels that would support full ethane recovery. Spot prices in Mont Belvieu were generally 18-19¢/gal in second-half 2015. PCC estimates recovery costs were 25-35¢/gal in primary producing regions (Texas-New Mexico, Kansas-Oklahoma, and Wyoming-Colorado) and 45-55¢/gal in the Marcellus, Utica, and Bakken shales.
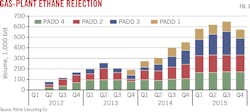
Recovery margins also remained well below breakeven levels in third-quarter 2015, with ethane rejection reaching a peak of 650,000 b/d for the quarter, according to PCC estimates.
While a decline in natural gas prices during early fourth-quarter 2015 weakened recovery costs to 21-22¢/gal for gas plants in the Texas-New Mexico and Kansas-Oklahoma regions, recovery margins in Texas-New Mexico subsequently improved enough for gas processors to increase ethane recovery at some gas plants. PCC estimates ethane rejection fell to 525,000-550,000 b/d in November-December 2015 (Fig. 3).
If gas processors had operated all gas plants at full ethane-recovery mode, total US NGL production would have been 3.95-4.00 million b/d in second-half 2015.
By mid-2017, petrochemical companies will complete construction of several new ethylene plants (OGJ, July 6, 2015, p. 74). Enterprise Products Partners LP (EPP) will also complete its ethane export terminal at Morgan's Point, Tex., in second-half 2016 (OGJ, June 6, 2015, p. 79).
During third-quarter 2016 through yearend 2017, feedstock demand for ethane and ethane exports will increase by 400,000-500,000 b/d.
By mid-2017, US gas plants in core producing regions (Texas-New Mexico, Kansas-Oklahoma, and Wyoming-Colorado) will be required to operate in full ethane-recovery mode to meet rising demand.
NGL market overview
Three markets account for more than 90% of US NGL demand:
• Petrochemical feedstock.
• Gasoline blending.
• Retail space heating, internal combustion.
All five NGL components are used as feedstock in petrochemical production, and normal butane, isobutane, and natural gasoline are used in gasoline blending. Retail space heating and internal combustion-engine markets, however, consume only propane. Of the three primary domestic end-use markets, only the petrochemical industry has the potential to considerably increase domestic NGL consumption. During 2017-19, petrochemical companies will start up a minimum of 15 billion lb/year of new ethylene capacity, almost all of which will be based on purity-ethane feedstock.
PCC estimates ethylene feedstock demand by direct contact with ethylene producers. Other segments of the petrochemical industry include propane dehydrogenation (propane), methyl tertiary butyl ether (MTBE; normal butane and isobutane), and propylene oxide (isobutane).
NGL demand in the ethylene feedstock market was 1.63 million b/d in third-quarter 2015 but increased to 1.67 million b/d in fourth-quarter 2015. PCC estimates demand was again 1.60-1.70 million b/d in first-quarter 2016. Demand in third-quarter 2015 was 128,000 b/d more than in third-quarter 2014. Year-to-year growth in demand, however, increased to 162,000 b/d in fourth-quarter 2015. Demand for NGL feedstock increased during second-half 2015 because these feeds continued to provide ethylene producers with lower production costs vs. refinery naphtha and gas oil.
Ethane accounted for 68-70% of ethylene industry NGL feedstock demand in second-half 2015. Ethane was responsible for 76% of growth in NGL feedstock demand during third-quarter 2015 and 87% in the fourth quarter (Table 3).
Gasoline blending demand
The refining industry is the second largest industrial-commercial market for NGLs. As is true for propane demand in retail markets, refinery demand for normal butane is strongly seasonal but demand for isobutane and natural gasoline is only moderately seasonal.
Refinery demand for normal butane reaches its seasonal peak November through January, while refinery demand for isobutane and natural gasoline is usually at its seasonal peak May through August. The counter-cyclical nature of refinery demand for isobutane and natural gasoline offsets some of the strongly seasonal demand for normal butane.
During the winter RVP season, refinery butane demand historically varied little from one winter to the next. Growing surpluses of ethane, propane, and normal butane, however, increasingly have resulted in weakening prices, prompting refineries-first at the US Gulf Coast and then in other regions-to make adjustments to gasoline blends during the winter months to take advantage of weaker normal butane prices.
In winter 2010, EIA data show inputs of gas plant normal butane into Gulf Coast refineries were 16.8 million bbl and remained near this level through winter 2012. Beginning to rise in winter 2013, Gulf Coast demand reached 23.9 million bbl in winter 2015.
At US East Coast refineries in winter 2010, normal butane demand was 2.2 million bbl, which began to rise incrementally starting in winter 2012 to reach 7.0 million bbl during winter 2015, according to EIA statistics.
For unknown reasons, however, RVP blending demand for gas-plant normal butane in the US Midcontinent remained almost flat 2010-15, within a range of 8.5-9.5 million bbl, EIA data show.
EIA statistics for refinery inputs show demand for butanes and natural gasoline was 453,000 b/d in third-quarter 2015 before increasing to 607,100 b/d in the fourth quarter. In first-quarter 2016, PCC estimates demand was 540,000-550,000 b/d.
According to EIA statistics, refinery inputs of gas-plant normal butane were 91,500 b/d in third-quarter 2015 and increased to 272,000 b/d in the fourth quarter.
EIA statistics show refinery inputs of isobutane increased to a new record high of 216,600 b/d in third-quarter 2015. As typically occurs during the winter months, refinery demand for isobutane fell to 207,400 b/d during fourth-quarter 2015 amid seasonal reductions in refinery crude runs and fluid catalytic cracking unit (FCCU) feed rates. PCC estimates demand continued to fall in first-quarter 2016 to 180,000-190,000 b/d alongside still-reduced crude runs and FCCU feed rates as US refineries carried out ongoing seasonal maintenance.
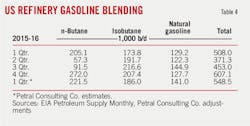
The factors that determine refinery demand for natural gasoline differ from demand drivers for normal butane and isobutane. PCC's ongoing economic analysis indicates refineries primarily seek natural gasoline for use as supplemental feed to pentane-hexane isomerization units. While some refineries have these units, many do not. This consideration results in demand variability that is not seasonal but instead more or less random. During third-quarter 2015, refinery demand for natural gasoline was 144,900 b/d before falling to 127,700 b/d in the fourth quarter, according to EIA statistics (Table 4).
Retail markets, NGL exports
Retail markets consume propane in four primary end-use segments:
• Residential, commercial, and resellers (space-heating markets).
• Agriculture.
• Motor fuel.
• Miscellaneous industrial.
Of these four segments, consumption in the residential-commercial sector typically accounts for 75-80% of total demand in the retail market. Unfortunately for propane retailers, winter 2015 was even milder than winter 2014. PCC estimates propane demand in all-end use sectors was just 590,000-600,000 b/d in fourth-quarter 2015 and 880,000-900,000 b/d in first-quarter 2016.
Demand in fourth quarter 2015 was 140,000-150,000 b/d (13-14 million bbl) less than in fourth-quarter 2014. Winter weather remained milder in first-quarter 2016, leaving demand 110,000-130,000 b/d (10-12 million bbl) less than in the same period of 2015. PCC estimates retail propane demand in winter 2015 was 23-26 million bbl less than winter 2014.
Waterborne exports continued to gain importance in 2015 as an outlet for surplus US LPG supply. According to statistics published by the US International Trade Commission (USITC), NGL exports (LPG exports + ethane and natural gasoline exports) topped 1 million b/d in third-quarter 2015 and remained above 1 million b/d in fourth-quarter 2015. Total NGL exports in the third quarter were 1.03 million b/d, or 292,000 b/d more than in third-quarter 2014. In fourth-quarter 2015, NGL exports were 1.01 million b/d, 239,000 b/d more than the last quarter of 2014. PCC estimates NGL exports increased to 1.14 million b/d in first-quarter 2016, which was 300,000 b/d more than first-quarter 2015.
Propane exports accounted for 63% of total NGL exports in third-quarter 2015 and 68% in the fourth quarter, with exports in January and February 2016 jumping to 861,000 b/d. Detailed statistics published by USITC show propane exports to destinations in Asia Pacific were 357,000 b/d in January 2016 and increased to 459,000 b/d in February 2016, with all exports to the region originating from export terminals on the Texas Gulf Coast. Exports to Asia Pacific accounted for 45% of total exports in January and increased to 57% in February. Exports of propane to Asia Pacific from Texas Gulf Coast terminals in January 2016 were 303,000 b/d more than in January 2015, with exports in February 209,000 b/d more than in February 2015.
US butane exports also continued to increase during second-half 2015 but not at propane's breakneck pace. Total butane exports to all destinations were 117,800 b/d in the third quarter, or 12,100 b/d more than in third-quarter 2014, while exports during fourth-quarter 2015 were 99,800 b/d, or 40,400 b/d higher compared with fourth-quarter 2014. PCC estimates butane exports fell to 65,000-70,000 b/d in first-quarter 2016, nearly unchanged from the same period in 2015 (Fig. 5).
EIA statistics showed US ethane exports to Canada of 58,800 b/d in third-quarter 2015, increasing to 66,000 b/d in the fourth quarter. While ethane exports historically have moved only to Canada, increased demand from overseas has spurred preparations for rising US ethane exports to destinations in Europe and Asia Pacific. Sunoco Logistics Partners LP completed commissioning a cryogenic storage and export terminal at Marcus Hook, Pa., in first-quarter 2016, loading its first shipment for export to Norway in March (OGJ Online, Mar. 11, 2016). EPP is scheduled to complete its ethane export terminal at Morgan's Point before year-end 2016 (OGJ Online, Nov. 11, 2015). In 2017, US ethane exports to ethylene producers in Europe and India will surge to 100,000-200,000 b/d.
Midstream infrastructure
NGL midstream companies historically have built and operated four basic elements of infrastructure:
• Gas processing plants.
• Raw mix purity-product transportation systems.
• Fractionators.
• Storage.
The midstream industry has typically focused all its resources and management efforts on expanding capacity in the first three elements but made no investment in expanding NGL storage and affiliated infrastructure. As US NGL supplies have increased to chronic surplus, however, a few midstream companies have expanded the industry's fifth element: LPG import-export terminals.
Export terminals were one of the industry's critical bottlenecks until second-half 2015. As with other major elements of midstream infrastructure, export terminal capacity was inadequate to meet the industry's rapid 2010-15 growth of propane and butane surpluses. In 2010, US midstream companies had LPG import terminals at several East Coast locations; two merchant LPG import-export terminals in the Houston Ship Channel; and two privately operated LPG import terminals in Louisiana and Texas. The export capacity at existing Houston Ship Channel sites was about 180,000 b/d in 2010. An idle facility in the Corpus Christi area was reactivated 2010-12, boosting total capacity along the Texas Gulf Coast to 230,000 b/d by yearend 2012.
As with other major elements of midstream infrastructure, midstream companies expanded the capacity of existing export terminals and launched new build projects during 2011-15. By year-end 2016, five companies (EPP, Occidental Chemical Corp., Phillips 66, Sunoco Logistics, and Targa Resources Partners LP) will have operational LPG export terminals on the Texas Gulf Coast. Based on information from company press releases and regulatory filings, the combined nominal capacity of LPG export terminals in the region was 925,000-950,000 b/d in late 2014 or early 2015. By yearend 2016, this will reach 1.2 million b/d.
During 2010-12, refrigeration capacity of export terminals at the Texas Gulf Coast was sufficient to accommodate the exportable surplus. Exports were 99,800 b/d in 2010, 109,800 b/d in 2011, and 155,600 b/d in 2012. In 2010 and 2011, the single-month maximum export rates were 128,000 b/d and 160,100 b/d, respectively. US ITC statistics showed Gulf Coast (all customs districts, including overland sites) propane exports spiked to 216,200 b/d in November 2012. Based on Customs District details, propane exports from the Houston-Galveston Customs District (which extends to Corpus Christi) were 197,600 b/d in November and 182,000 b/d in December.
Capacity was constrained 2013-14. As terminal operators completed each incremental expansion, LPG exports increased immediately. When nominal capacity at the Texas Gulf Coast reached 950,000 b/d in early 2015, however, capacity stopped being a limitation. LPG exports were 429,000 b/d in 2014 with the single-month maximum in December 2014 of 535,000 b/d. In 2015, LPG exports from Texas Gulf Coast terminals increased to 612,800 b/d with the single-month maximum of 752,000 b/d in December 2015.
Two companies also have operational East Coast LPG export terminals. Sunoco Logistics operates at Marcus Hook, and DCP Midstream at Chesapeake, Va. By yearend 2016, combined capacity of East Coast LPG export terminals will be about 300,000 b/d.
Price trends, profitability
PCC tracks gas processing economics based on netback values of NGL raw mix for gas plants in Texas, New Mexico, and the Rocky Mountains. Gas plants in these regions are the primary sources of NGL raw mix deliveries to NGL fractionators in Mont Belvieu.
Gas plant NGL production continued to increase in second-half 2015, but demand in domestic markets remained almost stagnant. Spot prices in Mont Belvieu for propane, butanes, and natural gasoline fell to levels not seen since 2002.
PCC estimates the weighted-average price of NGL raw mix in Mont Belvieu was 41¢/gal ($3.91/MMbtu) in third-quarter 2015. Prices recovered to 43¢/gal ($4.04/MMbtu) in fourth-quarter 2015 but fell to 37¢/gallon ($3.44/MMbtu) in first-quarter 2016.
Historically, competition among various feedstock options available to ethylene plants along the Texas-Louisiana Gulf Coast has been the paramount influence on Mont Belvieu NGL prices. While competitive economics in the Gulf Coast ethylene industry remain an important influence, the role of international markets has grown.
As US NGL exports expanded during 2013-15, pricing in Northwest Europe and Northeast Asia as well as international freight rates became more important influences on Mont Belvieu NGL pricing. Terminal fees for the new export terminals in the Texas Gulf Coast are 12-15¢/gal, with producer-exporters in the Middle East and North Africa able to operate without such fees. Freight rates from Houston to Japan also are consistently higher than from the Middle East to Japan. PCC views Gulf Coast terminal fees to be a fixed cost, but international freight rates vary with the availability of vessels for spot-cargo shipments.
Freight rates for deepwater LPG trade in international markets rose to record highs in first-half 2015. As ship owners received new world-class LPG vessels, fright rates began a sharp decline in third-quarter 2015. Ship yards continued to deliver additional new vessels in first-half 2016, and freight rates continued to fall. As a point of comparison, freight rates from Houston to Japan were 55-60¢/gal (not including export terminal fees) but began a fall in July 2015, reaching 12-14¢/gal in February-March 2016.
More LPG vessels are slated for delivery over the balance of 2016, and as additional vessels come into service, downward pressure on freight rates will increase. As US LPG supply growth slows, global markets will stabilize, while prices in Northeast Asia may increase if demand continues to grow at rates similar to second-half 2015. Given that LPG freight rates are variable and sometimes change several times in any given month, this variability is an important influence on spot prices in Mont Belvieu.
Outlook
As it almost always has been, the near-term outlook for supply and pricing is a function of crude oil prices. In an ideal scenario for midstream companies, crude oil prices would remain strong and US NGL production would steadily increase to create opportunities for midstream operators to respond to the ongoing need for additional pipeline and fractionation capacity in the domestic market and to further develop export terminal capacity to meet the needs of international markets. As upstream and midstream operators realize, however, this currently is not the case.
According to the Organization of Petroleum Exporting Countries' latest monthly Oil Market Report, Saudi Arabia increased crude oil production to 10.0-10.5 million b/d in second-quarter 2015 and maintained output constant at 10.1-10.3 million b/d in both second-half 2015 and first-quarter 2016.
Just before the Doha meeting (OGJ Online, Apr. 18, 2016), Saudi Arabia reminded global oil markets that it could raise its oil production to 11.5 million b/d within a matter of weeks. The reminder had limited immediate impact on crude oil prices for the various benchmarks.
Global markets, however, have already factored gradually increasing Iranian production into near-term supply expectations. PCC previously expected prices for global crude oil benchmarks to remain in the range of $40-50/bbl during first-half 2016 (OGJ, Nov. 2, 2015, p. 70). While a minor panic regarding US crude oil inventory and storage capacity sparked a sharp drop in crude oil prices in January and February, prices for WTI and Dated Brent quickly rebounded to $40-45/bbl. This aspect of the near-term outlook remains intact.
According to EIA statistics, US crude oil production in fourth-quarter 2015 was 9.31 million b/d, an increase of about 200,000 b/d from the same quarter in 2014. US production peaked in April 2015 before falling an additional 439,000 b/d by December 2015.
Production declined more slowly than markets initially anticipated in fourth-quarter 2014 when oil prices began to fall. But the number of oil-directed rigs in service continues to decline, and the rate of decline for US production is likely to accelerate during second-half 2016 and first-half 2017.
PCC expects US NGL production to stabilize at 3.25-3.50 million b/d in second-half 2016 before increasing to 3.40-3.60 million b/d in first-half 2017 as gas processors swing gas plants from ethane rejection to full recovery in the Texas-New Mexico and Kansas-Oklahoma regions.
Domestic demand for most NGL components will remain at current levels through yearend 2016 and into first-half 2017, but startup of two 750-tonne/year propane dehydration plants will coincide with increased chemical feedstock demand for propane of 15,000-25,000 b/d in first-half 2016 and 35,000-50,000 b/d in second-half 2016 vs. second-half 2015.
Finally, PCC forecasts propane exports will stabilize at 550,000-600,000 b/d during 2016, but ethane exports will increase to 100,000 b/d before yearend 2016. Butane exports will remain within the established ranges of 2014-15.
The author
Daniel L. Lippe ([email protected]) is president of Petral Consulting Co., which he founded in 1988. He has expertise in economic analysis of a broad spectrum of petroleum products including crude oil and refined products, natural gas, natural gas liquids, other ethylene feedstocks, and primary petrochemicals.
Lippe began his professional career in 1974 with Diamond Shamrock Chemical Co., moved into professional consulting in 1979, and has served petroleum, midstream, and petrochemical industry clients since. He holds a BS (1974) in chemical engineering from Texas A&M University and an MBA (1981) from Houston Baptist University. He is an active member of the Gas Processors Suppliers Association.
