India readies SAF scale-up for CORSIA Phase II
Key Highlights
- India is prioritizing SAF development to meet CORSIA Phase II compliance and reduce international aviation emissions by 2030.
- Policy measures include blending targets, tax incentives, and infrastructure investments to support domestic SAF production and supply chain readiness.
- HEFA from waste oils and alcohol-to-jet pathways are the most feasible near-term options due to cost and pathway readiness, with projected SAF demand reaching 35,000 b/d by 2030.
- Supply growth will be driven by refinery co-processing and standalone SAF plants, but actual volumes depend on offtake agreements and policy support.
- Cost premiums for SAF remain high, requiring long-term contracts, policy incentives, and demand-pull mechanisms to accelerate adoption.
With the Carbon Offsetting and Reduction Scheme for International Aviation (CORSIA) entering Phase II mandatory compliance in 2027, India—driven by one of the fastest-growing aviation markets globally—is positioning sustainable aviation fuel (SAF) as a practical instrument to lower lifecycle carbon intensity (CI) on international routes.
As priority shifts from policy rhetoric to operational reality, the near-term problem is converting announced capacity into reliably delivered, domestically counted tonnes at a commercially acceptable cost for airlines.
This article examines the implications of India’s transition to SAF through 2030, evaluated through the prism of CORSIA Phase II. Positioning India within the broader Asia‑Pacific policy acceleration on SAF ahead of 2027, the discussion traces the development of India’s domestic policy framework and converts projected jet‑fuel demand growth into implied SAF requirements for international uplift. Alongside briefly surveying ASTM‑approved SAF pathways and current blending limits and comparing pathway performance on lifecycle CI and indicative production costs, the analysis also assesses India’s announced SAF projects, with attention to feedstock mix, technology routes, and likely supply composition. Finally, the article estimates the prospective effect on lifecycle CI for international aviation, considering the operational and commercial implications across the value chain—including airlines, refiners, oil‑marketing companies (OMC), SAF producers, and government policy and regulatory levers.
Pre-Phase II SAF policy
In recent years, SAF has moved from a long-term decarbonization concept to an active policy priority. Europe and the US have provided the earliest large-scale demand signals through blending targets and incentives, and Asia-Pacific countries are now translating SAF ambition into roadmaps and early requirements.
The push is tightly linked to CORSIA, Phase I (2021–26) of which ran largely on voluntary participation. Mandatory from 2027, Phase II creates concrete compliance pressure that becomes much more real.
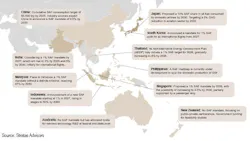
Ahead of Phase II implementation, Asia-Pacific countries have focused on SAF volumes most likely to be eligible and widely accepted under international sustainability rules, which is steering early policy toward waste- and residue-based SAF production, feedstocks for which are limited. As competition for these materials intensifies globally, countries are placing more emphasis on domestic supply chain development, not because rules alone create supply, but because eligibility rules and targets create a market signal that encourages investment in feedstock collection and traceability systems, conversion capacity, and airport-blending and distribution infrastructure (Fig. 1).
Asia-Pacific countries are adopting a stepped approach to targets and early mandates, with early targets typically starting small and scaling up through the decade. Japan has proposed an ambitious path toward 10% SAF share by 2030, while South Korea has signalled 1% SAF uplift for international flights from 2027. Alongside a 1% SAF share by 2026 that potentially rises to 3–5% by 2030, Singapore has also discussed ways (e.g., a passenger-levy concept) to help fund the cost gap. Thailand is also on a defined track, starting around 1% SAF uplift in 2026 set to increase over time.
Southeast Asian targets are closely tied to feedstock availability and trade. Malaysia and Indonesia are positioning around palm-linked supply chains and expanding used cooking oil (UCO) collection, with China anticipated to scale up later in the decade as targets tighten. India’s approach follows the same logic: prioritize SAF on international uplift where CORSIA applies, then consider broader domestic expansion. Australia and New Zealand SAF initiatives, however, for now remain more partnership- and study-led rather than mandate-led.
Asia Pacific SAF regulatory developments (Fig. 1)
Policy framework, institutional coordination
According to the International Air Transport Association (IATA), India’s aviation market is among the fastest growing globally, and policy work reflects that scale. In 2019, the country’s government issued its National Green Aviation Policy outlining broad aims to curb aviation emissions, accelerate civil aviation projects, and improve bio-jet fuel economics. More recently the Civil Aviation and Petroleum Ministries have jointly advanced an SAF roadmap that suggests blending guidance—1% for 2025–27, 2% by 2028, and 5% by 2030—that is currently more directional than prescriptive and explicitly linked to international uplift via CORSIA. To help narrow the cost gap for airlines, the roadmap has also considered support measures such as a lower goods and services tax (GST) rate (e.g., 5%) for SAF, waivers on certain airport charges for SAF-powered flights, investment support for OMCs to produce SAF, and practical enablers such as airport tankage and traceability systems.
Alongside government efforts, the broader ecosystem is also taking shape. Independent think tank World Resources Institute (WRI) India recently convened a multistakeholder roundtable on SAF pathways, highlighting the need to diversify fuel sources including waste-based feedstocks and power-to-liquids and to strengthen sustainability by early mapping of land and water impacts. India is also a founding member of the Global Biofuels Alliance, reinforcing its intent to position biofuels—including SAF—as part of the wider energy transition.
With policy direction becoming clearer, the country’s next step is to align domestic policy with global sustainability expectations.
Jet fuel demand
India’s jet fuel demand has fluctuated sharply over the past few years, falling drastically as COVID travel restrictions collapsed passenger volumes before rebounding quickly as air travel recovered.
Following the 2020 pandemic outbreak, demand fell by more than 50% to 79 million b/d from about 172 million b/d in 2019. In 2021, demand rose to about 108 million b/d, steadily increasing to 155 million b/d in 2022, about 180 million b/d in 2023, and roughly 197 million b/d in 2024 (Fig. 2).
India’s jet fuel demand (Fig. 2)
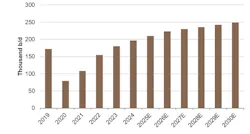
Forecasts in this analysis project a steady but more-moderate climb to about 223 million b/d in 2026 (up from 210 million b/d in 2025) and roughly 249 million b/d by 2030 for an equivalent 4% compound annual growth rate (CAGR) between 2024-30 driven by fleet expansion, more routes (especially to smaller cities), and rising passenger volumes.
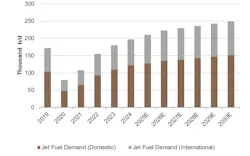
The domestic-international split also matters for SAF because CORSIA applies only to international flights. In 2024, domestic lift accounted for roughly 60% of total demand (about 121 million b/d) compared with 75 million b/d—about 40% of demand—for international lift (Fig. 3). That 60:40 ratio remains similar through 2030 when domestic and international uplift are projected near 150 million b/d and 99 million b/d, respectively.
India jet fuel demand split (Fig. 3)
SAF demand
With India’s jet-fuel demand rising, the size of the SAF opportunity increases in parallel, even at low blend rates, as SAF demand is ultimately driven by the size of the jet-fuel pool. As such, the baseline for assessing the scale and timing of SAF uptake under the roadmap depends on understanding India’s jet-fuel demand trajectory and its post-COVID recovery rate.
Early SAF uptake in India is most likely to concentrate on international uplift volumes, projected to be about 92 million b/d by CORSIA Phase II’s start in 2027. At the same time, the larger domestic segment will ultimately determine how big India’s total SAF market can become if blending expands beyond international-focused compliance.
The present outlook converts India’s projected jet-fuel consumption into implied SAF demand under the proposed guidance trajectory, with a particular focus on international uplift volumes where CORSIA-related pressure is most direct. India’s SAF demand is calculated as a share of the international jet-fuel pool (SAF demand = international jet-fuel demand × assumed SAF-blend rate).
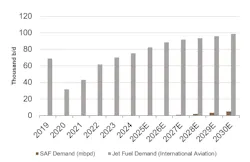
As Fig. 4 shows, international jet-fuel demand fell to about 31 million b/d in 2020 from 69 million b/d in 2019, then recovered steadily and is projected to reach roughly 99 million b/d by 2030. SAF demand stays at zero until the guidance begins.
Applying the roadmap’s stepped guidance to international uplift yields material SAF volumes even at single-digit blend rates: roughly 900,000 b/d at 1% in 2027, 1.8 million b/d at 2% in 2028, about 3.3 million b/d at 3.5% in 2029, and nearly 5 million b/d at 5% by 2030. The apparent rise in projected SAF volumes will make scaling of supply availability and airport-fuels logistics—especially at international hubs—central to success.
India’s SAF demand (Fig. 4)
SAF production pathways
ASTM International sets global technical standards defining pathways for what qualifies as safe, consistent, high-performing SAF for use in aircraft, including requirements to ensure its fitness as a drop-in fuel for blending with conventional jet fuel.
ASTM D7566 approves several SAF pathways, including hydroprocessed esters and fatty acids (HEFA), Fischer-Tropsch synthetic paraffinic kerosene (FT-SPK), and alcohol-to-jet SPK (ATJ-SPK; including ethanol-to-jet (ETJ) and isobutanol-to-jet (ITJ)). While most approved pathways can be blended up to 50% with conventional jet fuel—notably HEFA-SPK and ATJ/ETJ, two key pathways that can be used at the highest blend levels currently allowed—a few pathways have lower limits, such as synthesized iso-paraffins (SIP), a specific bio-derived production pathway, and hydrocarbon-HEFA (HC-HEFA), both of which are capped at 10% (Table 1).
ASTM D7566 approved SAF pathways (Table 1)

Co-processing under refinery standards (ASTM D1655) offers a near-term route for adding renewable content using existing units but is constrained to lower contribution levels compared with growing production from standalone SAF plants. Refiners are generally allowed to co-process up to 5% when using raw oils and fats (esters, fatty acids) or FT liquids with petroleum streams. For hydroprocessed (hydrotreated) lipid streams (i.e., HEFA-type material), ASTM allows up to a 10% co-processing threshold (Table 2).
But AFPM approval alone does not mean all SAF pathways are equal. For India, the combination of pathway readiness and feedstock availability points to HEFA (especially UCO-based) and ETJ/ATJ—both approved—as the most actionable near-term options because they are ASTM approved at higher blend levels (up to 50% under ASTM D7566) and can scale faster than more capital-intensive routes.
ASTM D1655 approved SAF co-processing levels (Table 2)

SAF pathway differences
The practical choice among SAF pathways hinges on lifecycle CI and production cost. Using conventional jet at about 85 gCO2e/MJ as the baseline, HEFA from UCO delivers substantial CI reductions (roughly 75% reduction to about 22 gCO2e/MJ) at relatively modest indicative costs (near $235/bbl in the analysis; Table 3).
ETJ outcomes vary, with 2G ETJ (agricultural residues like rice straw) able to deliver stronger CI improvements ($256/bbl) but materially weaker emissions benefits (about 64 gCO₂e/MJ; 28% reduction), making it harder to position under stricter sustainability and eligibility rules.
Deeper decarbonization routes—FT from residues and Power to Liquids (PTL)—offer the lowest CIs (FT in the 9-14 gCO2e/MJ range for 84–89% reduction; PTL near 8 gCO2e/MJ for 90% reduction) but at higher indicative costs (PTL being the most expensive in the analysis at near $800/bbl). Actual costs, however, will vary with feedstock prices, plant scale, conversion efficiency, hydrogen and power costs, and financing terms.
Overall, the analysis suggests the practical implication for India is that HEFA UCO is the lowest cost pathway to meaningful emissions reductions in the near term, while 2G ETJ and FT will need stronger policy support to scale.
Jet fuel, SAF pathway comparison (Table 3)

SAF project pipeline
India’s SAF capacity in the near term remains modest, but the current project pipeline—anchored by refinery-linked co-processing and larger stand‑alone plants—will determine how quickly the country can meet blending targets and participate in export markets.
Currently, India’s operational SAF base is limited to pilot and early commercial units operated by the Council of Scientific & Industrial Research–Indian Institute of Petroleum (CSIR‑IIP) and Praj Industries Ltd., respectively. Most announced capacity is scheduled for the mid‑tolate 2020s, with an initial increase anticipated from refinery co‑processing and a later, larger boost via dedicated SAF plants (Table 4).
The earliest meaningful additions are refinery‑side projects, led by Indian Oil Corp. Ltd.’s (IOCL) Panipat co‑processing HEFA unit (projected 2026) and Mangalore Refinery and Petrochemicals Ltd.’s (MRPL) co‑processing HEFA unit (projected 2027), followed by Bharat Petroleum Corp. Ltd.’s (BPCL) co‑processing units. While planned volumes from these projects are small, they are strategically important because they can come online sooner and help establish blending, storage, and distribution arrangements as proposed larger stand‑alone projects advance from 2027 onward.
Mumbai-based Essar Global Fund Ltd.’s (Essar) two-phased HEFA project at Salaya, Gujurat, will account for headline capacity additions—500,000 tpy in 2027 and a further 500,000 tpy in 2030—while AM Green (India) Pvt. Ltd. plans three second‑generation ETJ units totaling about 180,000 tpy between 2027-29. With public statements from Essar and AM Green indicating a focus on reaching international markets, nameplate capacities of the projects do not guarantee domestic availability for India’s blending mandates. As such, domestic supply will hinge on offtake contracts and the effectiveness of demand‑pull incentives.
Beyond these anchor projects, the broader project pipeline spans India’s major fuel and energy companies. HEFA remains the dominant pathway across both stand‑alone and co‑processing proposed projects by BPCL, IOCL, MRPL, and CSIR‑IIP, while planned volumes from Oil India Ltd. ETJ represent the second pillar, split between second‑generation ETJ (AM Green, the IOCL–Praj partnership) and first‑generation ETJ (IOCL–LanzaJet Inc., TruAlt Bioenergy Ltd., and Praj). Use of emerging technologies—including an electro‑SAF project by a venture of IOCL–Dornier-Werke GMBH and separate PTL projects by IOCL, National Thermal Power Corp. (NTPC) Ltd., and partners GPS Renewables Pvt. Ltd. and SAF One Energy Management Ltd.—appear later in the decade but at smaller nameplate volumes with greater execution risk.
While the announced SAF project list amounts to roughly 2 million tpy of nameplate capacity—including projects in planning and those targeting 2030 and beyond—the volume that will actually be available to meet India’s 2030 blending guidance could be materially lower should producers commit substantial volumes to international offtake or if later‑stage projects encounter delays.
India’s SAF project pipeline (Table 4)

Jet-fuel supply
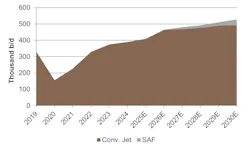
Between 2019-24, India’s jet-fuel supply was overwhelmingly refinery-led. Conventional refinery jet fuel production fell sharply in 2020 to roughly 150,000 b/d before recovering between 2022–24 as travel normalized (Fig. 5). During this period, jet-fuel availability was driven primarily by refinery throughput, utilization, and product yields.
Looking ahead, the outlook also remains refinery led. Conventional refinery jet-fuel supply is projected to continue rising through the late-2020s, reaching about 530,000 b/d by 2030, with non-refinery SAF supply appearing only from the late 2020s to grow gradually from a near-zero base. Even by 2030, SAF is anticipated to remain a small share of total jet-fuel supply, consistent with an emerging market where SAF supply levels-up through blending into the conventional pool rather than displacing refinery supply at scale.
Jet-fuel supply by source (Fig. 5)
SAF supply composition
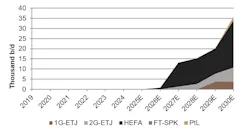
Should India’s announced SAF projects proceed as planned, the country’s total SAF supply is projected to reach about 35,000 b/d by 2030 (Fig. 6).
Projections in this analysis anticipate the supply mix during the 2026-30 period to be HEFA-dominated, indicating near-term growth to come primarily from lipid-based pathways that can scale sooner than other routes.
Though remaining secondary to HEFA in the overall mix, production from 2G-ETJ and FT-SPK pathways will begin contributing to supply from 2029–30, with 1G-ETJ remaining a smaller contributor toward the end of the forecast. PTL is present only as a thin tranche by 2030, suggesting PTL pathways will grow more slowly than bio-based routes in the near term.
For energy and aviation executives, investors, and policymakers, the immediate priorities are pragmatic and will require:
- Aligning incentives to make domestic offtake bankable.
- Investing in airport and supply chain readiness.
- Establishing lifecycle accounting and sustainability rules that provide revenue certainty.
SAF supply by source (Fig. 6)
Airline emissions
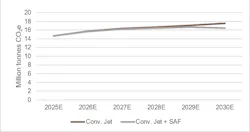
Analysis indicates using SAF reduces the emissions profile of international aviation, but it will not fully offset the underlying growth in flying. Under the conventional jet-only case, emissions increase steadily from 2025-30, reflecting rising international jet-fuel consumption (Fig. 7). When SAF is introduced (conventional jet + SAF), the emissions line remains below the conventional case every year, with the gap widening toward the decade’s end as SAF volumes rise.
The takeaway is that SAF mainly works by lowering the average lifecycle CI of the fuel mix rather than by reducing fuel consumption. In this analysis, SAF volumes used to meet international uplift demand are assumed to be supplied primarily by HEFA and 1G-ETJ. With international aviation activity projected to grow, absolute emissions will continue to trend upward. Blending SAF into the international jet pool, however, reduces average lifecycle emissions per unit of fuel, creating an increasing emissions wedge relative to the conventional-only pathway as blending rates rise from the late 2020s.
SAF impact on emissions from aviation sector (Fig. 7)
Airline cost, procurement
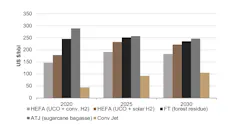
Based on the cost outlook, the price gap between SAF and conventional jet fuel remains substantial in both 2025 and 2030, implying that a blending premium persists even as some pathways improve with scale (Fig. 8).
In 2025, conventional jet fuel cost roughly $90/bbl, while SAF pathways ranged from about $190/bbl for HEFA (UCO + conventional H₂) to $255–260/bbl for FT (forest residues) and ATJ (bagasse). HEFA (UCO + solar H₂) sits between these at $230–235/bbl, illustrating the added cost of using higher-cost (green) hydrogen. With SAF costs still roughly two to three times higher than conventional jet fuel as of 2025, SAF uptake moving forward will depend heavily on contracting structures and the availability of policy or customer support to bridge the premium.
By 2030, conventional jet fuel rises to roughly $105/bbl, while the SAF range compresses but remains well above fossil jet. HEFA (UCO + conventional H₂) is expected to cost $180–190/bbl, HEFA (UCO + solar H₂) $220–225/bbl, and FT and ATJ $235-240/bbl. While the gap narrows from 2025 for some routes, SAF still carries a meaningful premium, particularly for pathways with higher-capital intensity or higher-cost inputs.
For airlines, the implication across 2025–30 is that SAF adoption is primarily a cost- and supply=assurance issue of securing dependable volumes and managing the premium through long-term offtakes and selective uplift at major hubs (especially international gateways). In practice, airlines are likely to start by using SAF at a few major international airports (e.g., where CORSIA-related pressure is strongest) and then decide how much of the added cost can be passed on via mechanisms such as corporate SAF purchases or ticket surcharges). Values shown in Fig. 8 should be treated as indicative benchmarks; actual costs can vary with feedstock prices, conversion yields and operating performance, plant scale and financing terms, and hydrogen and power costs.
SAF production-cost outlook by pathway (Fig. 8)
SAF producers
India’s project pipeline indicates that SAF producers must manage two linked requirements through 2030: delivering projects on schedule and at commercial scale and securing offtake agreements with buyers in the country’s domestic-based flight market, where SAF uptake is poised for growth. In practice, investment decisions are therefore shaped less by target announcements alone and more by the availability of long-term contracts, policy support that narrows the SAF price premium, and clear sustainability and certification rules that reduce revenue uncertainty.
Execution risks remain material, particularly for early commercial projects. Producer economics are highly sensitive to feedstock availability and pricing (especially for waste and residue categories), and to the effectiveness of collection and traceability systems. Delivered costs also depend on conversion yields, hydrogen and utility costs, plant reliability, and scale, meaning that operational performance can shift unit costs materially relative to indicative benchmarks. Financing conditions amplify these risks: early projects typically face higher contingencies and a higher capital cost, increasing the importance of credible technology partners, robust engineering, procurement, and construction execution capability, and strong balance sheets.
Finally, offtake strategy influences project bankability. Where domestic demand formation is slower, producers may seek diversified offtake options, including international buyers, to improve revenue certainty. But even for domestically oriented producers, central requirements remain the same: predictable demand-pull, a credible certification framework, and coordination with the downstream fuel supply system for delivery into aviation markets.
SAF suppliers, OMCs, transporters
Fuel suppliers, OMCs, and integrated refiners (IOCL, BPCL, MRPL) play the operational role in converting SAF availability into on-wing delivery. Their responsibilities include procurement, storage and handling, blending management where applicable, quality assurance, and documentation and traceability consistent with aviation fuel specifications. Because early SAF uptake will likely concentrate at major airports, operational readiness at those hubs—tankage, segregation procedures, testing capability, and compatible hydrant-trucking practices—becomes a practical constraint on scaling.
As the commercial link between producers and airlines, fuel suppliers influence how SAF volumes are allocated across airports and how the premium is reflected in delivered-fuel pricing. Contracting structures may vary (e.g., fuel supplier-procured SAF blended into supply, producer-to-airline offtake with fuel supplier delivery, or other arrangements), but each requires clear roles for certification, chain-of-custody, and claims management. As volumes expand, coordination across producers, fuel suppliers, airports, and airlines becomes increasingly important to avoid discontinuous supply and to scale SAF delivery without disrupting conventional jet-fuel logistics.
Government policy, implementation
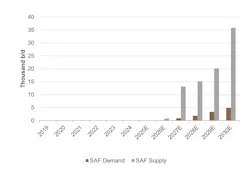
The projected balance between SAF supply and demand suggests that India could face a period in which nameplate production capacity expands faster than near-term domestic uptake, particularly if SAF use remains concentrated in international uplift (Fig. 9). In this setting, the policy question is not only how to enable production, but how to ensure that sufficient domestic demand-pull exists to absorb volumes onshore and translate capacity into measurable decarbonization outcomes.
India’s SAF balance (Fig. 9)
The first implication is that policy design needs to reduce the delivered cost premium of SAF for airlines. Measures such as targeted tax treatment (e.g., clarity on GST rules and regulations and relief where applicable), time-bound production incentives, and support for airport fuel-system readiness can lower the on-wing premium and improve airline willingness to contract SAF. Clear rules on sustainability eligibility and lifecycle accounting are equally important, since they determine which SAF pathways and feedstocks qualify, shaping both investment and pricing.
Second, implementation can be structured to broaden uptake beyond international routes. Because CORSIA applies only to international aviation, early SAF allocation may naturally concentrate at major international hubs. To increase adoption in domestic aviation, government can introduce phased domestic requirements or voluntary programs supported by demand-side mechanisms (corporate SAF programs, green fare frameworks, or crediting schemes) and ensure that claims and compliance accounting are robust and avoid double counting.
Finally, policy credibility depends on execution. Producers require bankable offtake and stable rules to finance projects, while OMCs need clarity on blending responsibilities, quality assurance, certification, and traceability. A coordinated approach linking aviation and petroleum agencies, airport operators, and fuel suppliers can reduce transaction costs and accelerate learning-by-doing in blending and logistics. Overall, converting projected capacity into domestic emissions impact will likely require a mix of price-gap support, clear sustainability rules, and implementation frameworks that progressively extend SAF uptake from international uplift into the domestic market.