Production restraint by OPEC, others key to oil-market balance this year
Conglin Xu
Senior Editor—Economics
Laura Bell
Statistics Editor
With continued production discipline from Saudi Arabia, Russia, and other oil-exporting countries, the global oil market will be generally balanced this year, Oil & Gas Journal forecasts.
Oil demand will continue to increase in 2018, backed by the solid recovery of the global economy, especially in emerging markets.
Nevertheless, oil demand growth may decelerate slightly from a year ago, 1.3 million b/d vs. 1.5 million b/d, according to the International Energy Agency. This is mainly because consumption in members of the Organization for Economic Cooperation and Development, representing industrialized countries, will be dampened by rising oil prices.
Non-OECD demand will continue to grow strongly this year. Non-OECD Asia, excluding China, is expected to have the strongest oil demand growth in 2018. Meanwhile, oil demand growth in China will weaken as economic growth slows and the credit market tightens.
Supply remains subject to management by 12 members of the Organization of the Petroleum Exporting Countries and 10 non-OPEC exporters led by Russia, which agreed to extend their agreement through 2018. Agreements by OPEC producers to cut output from 2016 baselines by 1.2 million b/d and by non-OPEC exporters by 600,000 b/d took effect at the start of 2017.
Compliance with the production agreements has been high.
If that continues, production growth in 2018 will occur in countries outside the agreements. The key growth surprise could come from US shale. Canada and Brazil also have major projects starting up. Non-OPEC supply is expected to grow by 1.6 million b/d in 2018, according to IEA.
Meanwhile, OECD commercial oil inventories have fallen from very high levels in 2016 toward 5-year average levels. OECD commercial oil stocks in October 2017 fell to 2.94 billion bbl, their lowest level since July 2015.
With total oil inventories back within their 2012-16 range, sensitivity of the oil market to supply disruption has been restored.
Global oil demand
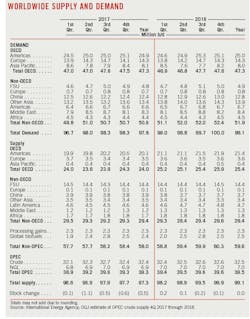
In 2017, average worldwide demand for oil increased to 97.8 million b/d, 1.5 million b/d higher than a year earlier, according to IEA’s December Oil Market Report. The increase in 2017 included a 400,000 b/d gain in OECD countries, led by OECD Europe and Americas, and a 1.2 million b/d increase in non-OECD countries, led by China and the rest of non-OECD Asia.
Demand growth in 2017 exceeded early-year forecasts and sustained growth seen in the past 3 years. OECD Europe contributed most to the upward revisions due to solid progress in industrial consumption and strong transportation demand.
This year, a strengthening global economy, particularly in emerging markets, means another year of healthy oil demand. Partially offsetting demand strength related to economic growth might be higher oil prices and recent cuts by many countries of consumption subsidies.
In its latest World Economic Outlook, the International Monetary Fund (IMF) projected global growth at 3.7% in 2018, following 3.6% in 2017.
Global oil demand will increase by 1.3 million b/d in 2018, with non-OECD countries contributing to nearly all the growth, according to IEA’s most recent forecast. This is a slight deceleration from 2017 growth of 1.5 million b/d.
OECD oil demand growth, which has been most sensitive to oil price declines in recent years, will likely cease this year under the weight of higher oil prices and overall weaker economic growth.
Economic growth in OECD Europe is expected to fall to 1.9% this year from 2.1% projected for 2017, according to IMF. In Japan, as fiscal stimulus fades, economic growth is expected to weaken to 0.7% in 2018, following 1.5% in 2017. Oil demand in OECD Europe will flatten, while demand in OECD Asia will decline from a year ago.
The only exception is OECD Americas, where oil demand will continue to grow this year because of strong economic growth in the US.
Non-OECD demand will expand by 1.3 million b/d this year, following increases of 1.2 million b/d in 2017 and 900,000 b/d in 2016. The growth rate for emerging-market and developing economies is forecast to rise to 4.6% in 2017 and 4.9% in 2018 from 4.3% in 2016.
Notably, irrespective of oil prices or global economics, non-OECD demand has been driven by powerful structural trends including population growth, industrialization, and urbanization.
Oil demand in China will climb to an average 12.8 million b/d this year from 12.4 million b/d last year and 11.9 million b/d in 2016. China’s economy is expected to grow 6.5% in 2018, compared with 6.8% in 2017.
Demand elsewhere in non-OECD Asia will grow 500,000 b/d in 2018. Indian demand will be much stronger in 2018 than in 2017. Demand in other non-OECD regions will rise slightly.
Currently, approximately 56% of global oil demand is transportation-driven. Industry accounts for 18% of global oil demand, and 12% is related to petrochemicals.
In its 2017 World Energy Outlook “New Policies” scenario, which incorporates existing and announced government policies, IEA estimated that global oil demand growth will decelerate over time but continue to grow through 2040.
World oil supply
Reported compliance by OPEC members agreeing to limit production averaged 91% during January-November 2017, according to IEA. Although compliance weakened considerably in June and July, it picked up month by month afterward and reached 115% in November.
Saudi Arabia had remained below its supply target since January of 2017, cutting nearly 600,000 b/d on average over the year. Saudi Aramco has also cut exports to the US sharply. Some OPEC members, such as Angola and Venezuela, are battling structural production declines because of sagging investment.
On Nov. 30, OPEC and non-OPEC producers led by Russia agreed to extend crude oil output cuts until the end of 2018, in line with market expectations.
Libya and Nigeria, the only OPEC members outside the agreement to limit production, promised not to produce oil at more than recent rates during 2018—probably because they will not be able to do so anyway. In Libya, for example, 12 of 19 storage tanks at Es Sider and half of the 19 storage tanks at Ras Lanuf are out of operation.
OGJ estimates OPEC crude oil production averaged 32.4 million b/d in 2017, a 400,000 b/d decrease from 2016 levels, and forecasts a slight increase to 32.5 million b/d in 2018.
Although OPEC is expected to restrain production growth, higher output from non-OPEC countries will contribute to growth in world oil supply in 2018.
In its December Oil Market Report, the IEA expected non-OPEC oil supply—which includes liquids production, processing gains, and biofuels—to average 59.6 million b/d in 2018, 1.6 million b/d higher than the 2017 levels. In 2016, non-OPEC oil supply was 57.4 million b/d.
This growth, together with the forecast 100,000 b/d growth in OPEC crude oil production and a 100,000 b/d increase in OPEC NGL production, results in total growth of 1.8 million b/d in global liquids supply.
Non-OPEC oil supply for 2018 is led by strong growth expected in the US. Output in Canada, Brazil, and the UK are also expected to increase in 2018.
With increased investment in tight oil and improved well efficiency, US crude oil production is forecast to increase an average of around 800,000 b/d in 2018, according to OGJ. US NGL production is also increasing rapidly.
Canada’s production in 2017 is expected to have been 290,000 b/d higher than in 2016 and to show a similar gain in 2018, according to IEA. Gains will primarily come from ExxonMobil’s late-2017 start-up of Hebron heavy oil field and from the imminent start-up of Suncor’s 194,000 b/d Fort Hills bitumen mine.
Despite the shutdown of the Forties Pipeline System in early December last year, UK output is set to increase by around 150,000 b/d this year. Gains will come from the ramp-up of the Quad 204 redevelopment of Schiehallion and Loyal fields and the start-up of Clair Ridge field. Both projects are in the West of Shetland area.
Output in Brazil will grow strongly this year from planned new production. Brazil accounts for an inordinate share of non-OPEC start-ups after 2017, 40% of total major project capacity.
The Former Soviet Union region will likely keep output steady. In 2017, Russia committed to cut production by 300,000 b/d and had achieved an average 2017 compliance of around 81% through November. Output is likely to hold around current levels following the decision to extend production management to the end of 2018.
In Kazakhstan, Kashagan field will reach its 370,000 b/d target during 2018, rather than by the end of 2017 as previously announced, according to operator North Caspian Operating Co.
Chinese and other Asian oil production in 2018 will continue to decline with no major projects coming online.
Since reaching a record high of almost 3.09 billion bbl at the end of July 2016, total OECD commercial oil inventories have fallen to 2.95 billion bbl at the end of November 2017. Over the same period, the amount by which inventories exceed the 5-year average has declined by 210 million bbl, ending November at an estimated 174 million bbl.
US economy, energy
With help from federal deregulation and other policies, the US economy gained momentum over 2017. Expansion is projected to continue in 2018 and 2019.
Fiscal policy changes will sustain the trend. Lower tax rates on corporate and personal income will stimulate investment and consumption.
Monetary policy, meanwhile, continues to normalize gradually. The Federal Reserve has raised its policy rates and begun slowly to trim its holdings of financial assets accumulated after the recession of 2008.
The labor market has continued to strengthen. Wage growth will accelerate as it tightens further in response to the fiscal-policy boost.
Along with strong business and consumer confidence, the major US stock indexes are all trading around record levels. Consumption remains robust, supported by wealth gains from buoyant asset prices and stronger income growth. Business investment is rebounding from the lull following the fall in oil prices and past exchange-rate appreciation.
OGJ forecasts that US gross domestic product will grow 2.5% this year, compared with 2.1% in 2017. In 2016, US GDP grew 1.5%.
US energy demand will increase 0.8% this year, OGJ forecasts, from a 2017 total of 97.45 quadrillion btu (quads). Fossil energy continues to account for the bulk of US energy consumption. Petroleum consumption has increased in each of the past 4 years.
US oil demand
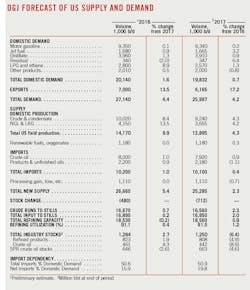
In 2017, in line with growing industrial activity, US oil demand increased by 150,000 b/d, or 0.7%, with each main petroleum category on the rise. The largest gains were in jet fuel-kerosene, fuel oil, diesel oil, and LPG and ethane.
Gasoline demand increased 0.2% in 2017 to an average 9.34 million b/d on the back of increased vehicle-miles traveled, partly offset by efficiency gains. Gasoline demand also benefited from hurricane disruptions, as cleaning and reconstruction work led to higher demand. In addition, the emergency generation of electricity from gas-oil-fired generators supported demand.
The year-over-year growth of US manufacturing production and higher freight transportation supported diesel demand. Rising US imports of goods boosted diesel demand by lifting truck traffic.
US jet fuel demand was surprisingly strong in 2017 in view of rising prices: up 3.2% over a year earlier. Residual fuel consumption increased 6.4%. LPG and ethane demand grew 1.3%, averaging 2.57 million b/d, backed by the expanding petrochemical industry.
US oil production
US crude oil production will continue to rebound from its recent low in 2016 of 8.86 million b/d. OGJ forecasts that crude oil production will climb to a record-high average 10.02 million b/d this year from 9.24 million b/d last year. The current record for US crude production is 9.6 million b/d, set in 1970.
Most of the growth in US crude oil production will come from tight formations the Permian basin and from the federal Gulf of Mexico.
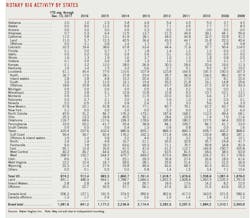
According to Baker Hughes, the number of active US rigs drilling for oil was 747 in the week ended Dec. 15, 2017, compared with 510 a year earlier. Over 50% of land rigs working in the Lower 48 last year were in the Permian region.
Analysts at Simmons & Co forecast the oil rig count to average 778 in 2017, 856 in 2018, and 922 in 2019.
Increased drilling reflects not only higher crude prices but also improved cash flow from lower costs, higher productivity, and increased hedging.
Based on a Standard Chartered sample of 66 companies, US independent oil producers greatly increased their hedges for 2018 production during the third quarter of 2017 when oil prices rose. Permian basin producers hedged 72% of their 2018 output, while Bakken producers increased hedges to 69% of their production.
According to the Barclays capital spending survey, North America upstream spending will increase 21% this year, compared with 35% in 2017. Barclays warns that renewed calls for exploration and production capital discipline could counterbalance improved cash flows from higher oil prices.
Meanwhile, according to data from Rystad Energy, completion rates across the US tight oil regions have risen. In October 2017, 978 horizontal oil wells were completed, compared to 900 drilled. The number of wells brought on stream thus exceeded those spudded for the first time since mid-2016.
In 2016, eight projects came online in the Gulf of Mexico. Seven more projects are expected to come online by the end of 2018. Crude oil production in the gulf is expected to increase to an average 1.7 million b/d in 2018 from 1.65 million b/d in 2017 and 1.6 million b/d in 2016.
Alaskan oil production averaged an estimated 490,000 b/d, unchanged from a year earlier. In its December 2017 Short-Term Energy Outlook, EIA forecasts that Alaskan oil production this year will fall to 480,000 b/d.
OGJ forecasts that NGL production this year will average 1.76 million b/d, up from 1.75 million b/d last year and 1.739 million b/d a year earlier.
Oil trade
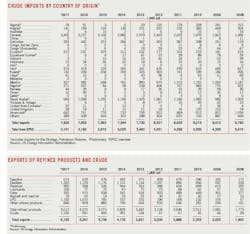
According to OGJ estimates, US crude oil exports in 2017 increased by more than 400,000 b/d from 2016, reaching a record high 1 million b/d. Petroleum product exports also set a record at more than 5 million b/d.
Following the removal of restrictions on exporting US crude oil in December 2015, export amounts and the number of destinations increased. As of September 2017, the US exported crude to 31 countries, compared with 27 countries in 2016 and 10 countries in 2015, according to EIA.
Canada remained the largest recipient of US crude exports, 310,000 b/d as of September 2017, but imported an average of 65,000 b/d less compared with the same period of 2016. China increased its crude imports from the US by 161,000 b/d and became the second largest importer of US crude oil, averaging 184,000 b/d.
The global reach of US oil products is expanding rapidly as well. For the first 9 months of 2017, US gasoline export destinations reached 41 countries, compared with 33 over the same period of 2016. The distillate export reach increased to 62 countries from 54 a year earler.
In 2017, despite consistently strong domestic demand, US distillate exports were 14% higher than in 2016, with exports to South and Central America accounting for most of this growth. Mexico remained the largest single destination for US distillate, averaging 17% of total exports, followed by Brazil and Chile. The share of distillate exports to Western Europe fell.
Over the first 9 months of 2017, US exports of finished motor gasoline averaged a record high 674,000 b/d, a 17.8% increase from the same period in 2016. Mexico was the destination of more than half of total US gasoline exports in 2017. Recent market reforms in Mexico, which allow entities other than state-owned Pemex to import petroleum products, may have contributed to the recent growth in Mexico’s gasoline imports from US. Although Mexico produces large amounts of crude oil, the country’s refinery output of products such as gasoline has been declining since 2015.
Over the first 9 months of last year, US propane exports reached a record high of 873,000 b/d, up from 756,000 b/d over the same period of 2016. Most of this increase is from US exports to Asia, mainly China, Japan, and Korea, which now make up most of the destination countries for US propane.
US imports of crude oil rose to an average 7.92 million b/d in 2017 from 7.85 million b/d in 2016, OGJ estimates. Product imports, which increased 5.7% in 2016, moved down slightly last year to average 2.18 million b/d.
The leading source of US crude imports in 2017 was Canada, followed by Saudi Arabia, Venezuela, Iraq, and Mexico.
Production management by OPEC and other producers changed US crude-import trends in 2017.
Saudi Arabia reduced crude oil exports to most regions, including to the US, because of both its voluntary crude oil production cuts and the increase in the amount of crude refined domestically. Overall, total US crude oil imports from Saudi Arabia fell to the lowest level in 30 years, with some of that decline made up by increased imports from Iraq.
Reduced production in Venezuela has lowered the amount of Venezuelan crude available for export, with some cargoes being diverted away from the US to other countries to repay oil loan agreements. In September 2017, total US imports of Venezuelan crude oil fell to the lowest point since 2003.
Combined, in 2017, estimated US net imports of crude averaged 6.85 million b/d, down 5.6% from a year earlier. US net imports of crude will continue to sink this year, mainly due to the expected exports increase. Estimated US net exports of products averaged 3 million b/d, up 23% from a year ago, and will continue to grow this year.
Refining
US refining started 2017 sluggishly, with bloated gasoline and distillate inventories and a warm winter. Refining margins were declining due to weak crack spreads and narrow sweet-sour differentials.
However, after the middle of the year, refining margins started to rally amid crude price declines and reduced crude runs due to Hurricane Harvey.
In August, Hurricane Harvey caused around 4 million b/d of refining capacity in the Texas Gulf Coast to preemptively halt operations or reduce runs.
Moreover, the price spread between Brent and WTI widened due to export bottlenecks, providing cheaper domestically sourced crude.
Refinery utilization rates rebounded to high levels during November. Expectations of a cold winter and low stocks of gasoline and middle distillates drove refinery runs upwards.
In 2018, US refiners are expected to continue running at high rates to rebuild product stocks; meet demand for winter heating oil, transport fuels, and petrochemical feedstocks; and take advantage of export opportunities.
Product exports, especially distillate and gasoline exports, continue to account for a growing share of total demand, providing fundamental support to US refiners.
As refiners become more reliant on international buyers to clear the domestic market, a risk premium needs to be ascribed to export volumes, according to Jefferies.
“The export market needs to consistently price accordingly to clear on a ratable basis, and we do not know which country is buying our crude or refined products until 2 months after the fact (EIA time lag); certain risk adjustments should be taken into consideration,” the consultancy says.
Inventories
Stocks of crude and products finished 2017 lower than a year earlier. Yearend crude inventories, excluding the Strategic Petroleum Reserve, were down nearly 9%. Total product stocks at yearend 2017 were down 5%.
Nearly all major product stocks were lower at yearend 2017. Inventories of total motor gasoline were down 4%, of jet fuel down 3.5%, and residual fuel down by more than 12%.
The amount of crude oil in the SPR stood at 663 million bbl at the end of 2017, compared with 695 million bbl at yearend 2016. The SPR is expected to end 2018 at 646 million bbl.
Natural gas
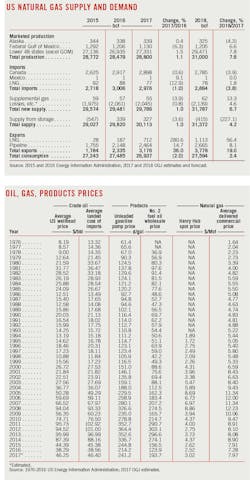
US natural gas consumption last year declined 2% from a year earlier, primarily reflecting less use in power generation due to higher gas prices. For all of 2017, gas usage in power generation averaged 25.49 bcfd, 6.5% lower than in 2016, according to EIA.
The Henry Hub natural gas spot price averaged $2.27/MMbtu from Apr. 1, 2016, through July 25, 2016, compared with $3.03/MMbtu during the same period in 2017. Average natural gas prices at power plants were $1.02/MMbtu higher in the first half of 2017 compared with the first half of 2016, while coal prices were about the same in the first half of both years.
OGJ forecasts that US gas consumption will rebound 2.4% this year because of colder winter weather and an increase in gas use for power generation. Gas consumption by industrial users will also inch up this year.
Temperatures this winter 2017-2018, based on the most recent forecast of heating degree days from the National Oceanic and Atmospheric Administration (NOAA), are expected to be 13% lower than last winter and 1% above than the 30-year average. The colder weather will place upward pressure on gas prices. La Nina is a wildcard in winter weather outlook.
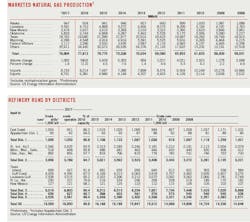
Marketed production of gas in the US last year jumped 1.1% from a year earlier to 28.8 tcf. OGJ forecasts that marketed gas production will continue to increase strongly this year.
Takeaway capacity from the Marcellus and Utica supply regions is increasing thanks to new pipelines, including the Rover and Nexus Gas Transmission pipelines. In addition, well performance continues to improve in the Appalachian region.
The US has been a net gas exporter for 2017 and is expected to continue to export more natural gas than it imports throughout 2018 as exports to Mexico and of LNG increase and as pipeline imports from Canada decline.
While gas production in Mexico is declining, the country expects to increase its gas use for power generation by almost 50% between 2016 and 2020. Current US gas pipeline export capacity to Mexico is 7.3 bcfd and is expected to be nearly doubled by 2019. Meanwhile, Mexico’s gas pipeline network is undergoing a major expansion, primarily to accommodate imports from the US.
Gas from the Appalachian basin and other northern US producing areas is displacing US imports from Canada.
According to EIA, imports from Canada averaged 7.9 bcfd in 2016, while exports to Canada averaged 2.1 bcfd over the same period. In 2017, based on year-to-date preliminary data, imports from Canada had increased to 8.15 bcfd, while exports to Canada had increased to 2.54 bcfd, resulting in a 200 MMcfd decrease to net supply from Canada. In 2018, net imports from Canada will decline further.
US LNG exports averaged 1.94 bcfd in 2017, compared with 510 MMcfd a year earlier. LNG imports declined to 210 MMcfd from 240 MMcfd in 2016.
In August 2017, total US gas liquefaction capacity in the Lower 48 states increased to 2.8 bcfd following the completion of the fourth train unit at the Sabine Pass LNG terminal in Louisiana.
A fifth train at Sabine Pass, and five new projects—Cove Point, Cameron, Elba Island, Freeport, and Corpus Christi—will come online subsequently, increasing total US liquefaction capacity from 1.4 bcfd at the end of 2016 to 9.5 bcfd by the end of 2019.
Based on construction plans, EIA expects that by 2020 the US will have the third-largest LNG export capacity in the world after Australia and Qatar.
About the Author
Conglin Xu
Managing Editor-Economics
Conglin Xu, Managing Editor-Economics, covers worldwide oil and gas market developments and macroeconomic factors, conducts analytical economic and financial research, generates estimates and forecasts, and compiles production and reserves statistics for Oil & Gas Journal. She joined OGJ in 2012 as Senior Economics Editor.
Xu holds a PhD in International Economics from the University of California at Santa Cruz. She was a Short-term Consultant at the World Bank and Summer Intern at the International Monetary Fund.
Laura Bell-Hammer
Statistics Editor
Laura Bell-Hammer is the Statistics Editor for Oil & Gas Journal, where she has led the publication’s global data coverage and analytical reporting for more than three decades. She previously served as OGJ’s Survey Editor and had contributed to Oil & Gas Financial Journal before publication ceased in 2017. Before joining OGJ, she developed her industry foundation at Vintage Petroleum in Tulsa. Laura is a graduate of Oklahoma State University with a Bachelor of Science in Business Administration.

