Near-term oil market outlook remains complicated
Despite record compliance with oil output cuts reported by the Organization of Petroleum Exporting Countries, global oil stockpiles and export levels have remained high. Both OPEC and non-OPEC producers, notably Russia, decided in May to extend a production-cut agreement until the end of first-quarter 2018. However, the decision failed to reignite the excitement seen in November 2016 when the OPEC output-cut deal was first introduced.
Oil has been weighed down by the market's impatience with the slow pace of rebalancing. Rising US supplies and a recovery in Libyan and Nigerian output raised worries about excess supply. At presstime last week, crude oil prices were back to levels of late last year before the supply-cut agreement was made.
Looking ahead, the near-term outlook of the oil market remains exceedingly complicated, with a wide range of potential outcomes.
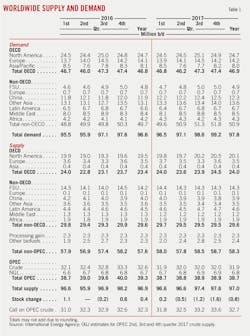
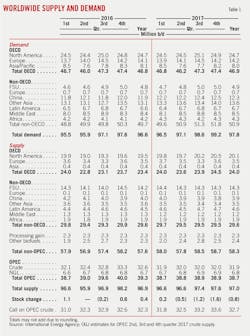
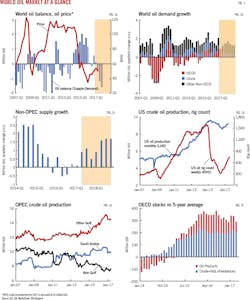
It is fortunate that global economic activity is firming broadly. Although global oil demand growth was muted in this year's first quarter, it accelerated in the second quarter and is expected to continue the momentum in this year's second half. According to the International Energy Agency's forecasts, demand growth will increase modestly to 1.4 million b/d in 2018 from 1.3 million b/d this year, led by non-members of the Organization for Economic Cooperation and Development.
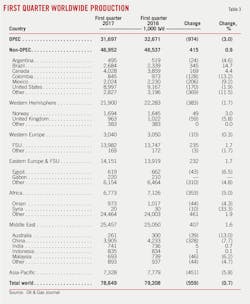
Total non-OPEC production is more resilient than expected, rising 700,000 b/d this year following a drop in 2016. The first outlook for 2018 makes for sobering reading for those producers looking to restrain supply. In 2018, non-OPEC production is expected to rise 1.5 million b/d because of continued major project startups and ensuing production tails. The growth is slightly more than the expected increase in global demand.
US production, as anticipated in earlier forecasts, is rising strongly. OGJ expects US crude supply to average 9.3 million b/d in 2017, following further rig additions and increased spending. The first look at 2018 suggests that US crude production will continue to rise strongly, given current higher price forecasts and technical advances. However, there is downside risk to US output if prices remain subdued.
Combined, destocking could take a long time. After the end of the cut extension, the need for continued OPEC and Russian rational guardianship is emerging. However, this remains a big ask.
Aside from the complicated fundamental trends, the violent price moves of late suggest that the oil market is in a very fragile state in which sentiments are binary and the herd mentality is wickedly strong as shown by the noteworthy participation of non-commodity traders.
According to RBC capital markets, compared with earlier this decade, the baseline level of investor shorts in the market has more than doubled since oil prices first started falling in mid-2014, reflecting the sheer pace of the positioning from entry to exit, which is seemingly occurring at a faster rate than in the past.
The world economy
Despite increased geopolitical risks, global economic growth has been robust as investment, industrial activity, and trade are picking up from previous levels. Inflation indices have lowered in developed and emerging nations because of lower energy prices.
In the June issue of global economic prospects, the World Bank forecasted the world real gross domestic product to rise 2.7% and 2.9% in 2017 and 2018, respectively, compared with 2.4% in 2016.
Led by the US, activities in advanced economies are expected to gain momentum this year. Growth forecasts in OECD Europe and Japan have also been upgraded, reflecting stronger demand and exports.
US economic growth is projected to accelerate in 2017 and 2018. Consumer spending benefits from continued employment gains and strong wage growth. A tax reform is projected, which will support consumer spending and investment in 2018. As inflation is near its target and unemployment edges down further, the Federal Open Market Committee raised the target range for short-term interest rates, although it remains relatively low.
Despite political uncertainties surrounding Britain's exit from the European Union, or Brexit, Eurozone GDP growth was robust in 2016 and the momentum continued in 2017. Manufacturing activity and exports have been lifted by strengthening global trade and investment. The unemployment rate fell throughout 2016 to reach 9.5% in this year's first quarter, about 2.5% below its peak in 2013. The manufacturing purchasing managers' index (PMI) in the Eurozone rose to a multiyear high in May.
Aided by stronger international trade and fiscal stimulus, Japan's economic growth is projected to edge up in 2017. Japanese exports rose strongly during this year's first half, supported by the relatively weak value of Japanese yen. Retail sales for the first quarter have steadily increased, rising at the fastest pace since April 2015.
The Chinese economy has continued to grow, although the slowdown in growth may continue. Chinese fixed investment spending, including housing market investment, rebounded early this year. The weakness in trade observed during the past several years abated, with imports and exports growing consecutively. The Belt and Road and the Beijing-Hebei-Tianjin corridor are aimed to spur infrastructure investment. Meanwhile, mounted financial risks and corporate debt problem post downside risks. Moody's downgraded China's sovereign debt rating for the first time since 1989.
World oil demand
Global oil demand has been growing at a steady pace for several years, mainly due to lower prices. Supported by global economic growth, oil demand growth may accelerate modestly to 1.4 million b/d after a gain of 1.3 million b/d in 2017, according to recent IEA estimates.
Demand averages 97.84 million b/d in 2017, rising to 99.27 million b/d in 2018 and breaching the psychologically important 100 million b/d threshold in fourth-quarter 2018, IEA forecasts.
Thanks to a combination of robust macroeconomic conditions, demographic factors, and lower existing base levels of per-capita demand, China, India, and the rest of emerging Asia have and will continue to make up most of global oil demand growth.
According to IEA's most recent forecast, non-OECD economies account for nearly all of the forecast growth in 2018 and 94% of the anticipated 2017 increase, with China and India driving the demand expansion.
China oil demand remains substantial, with the bulk of the volumes coming from motor gasoline, diesel, LPG, and ethane, driven by industrial activity, petrochemicals, and transportation. Total products demand growth could rise 3% in 2017.
After the declines in this year's first quarter following the negative impact from the recent currency reforms, India's oil demand would tentatively return to growth. India's Petroleum Planning and Analysis Cell reported that May oil demand increased 5.4% year-over-year. This represented the second consecutive month of demand growth, following April's 3% gain.
IEA also forecasts India's oil demand growth to average 330,000 b/d in this year's second half before accelerating in first-quarter 2018 to 470,000 b/d. Road transport fuels, bitumen, and LPG will account for most of the strong gains foreseen.
After outperforming over the last 2 years, OECD demand growth has largely reverted to relatively anemic growth rates. Total OECD demand is now expected to rise 0.3-0.4% in 2017 compared with a 1% rise in 2016.
Over the last 2 years, the US was the engine of OECD demand growth. Gasoline almost single-handedly carried the US and OECD demand growth. This year, the outlook for vehicle metrics is not particularly rosy. Growth in US gasoline consumption is slowing after 2 years of rapid increases, as continued growth in driving is offset by fuel economy. However, declines in gasoline demand will be notably offset by robust demand growth in distillate, jet fuel, LPG, and ethane in 2017.
According to IEA data, OECD European oil product demand during January-April has averaged 13.9 million b/d, just up 0.8% compared with the same period in 2016, a significant slowdown on recent years. European oil product demand growth averaged 1.8%, or 235,000 b/d, in 2015, and 2.4%, or 335,000 b/d, in 2016.
Japanese oil demand continued to decline in 2017 as the substitution with natural gas and coal has taken its toll on the country's overall oil demand growth. Other factors include the demographically aging population and increasing efficiency gains.
World oil supply
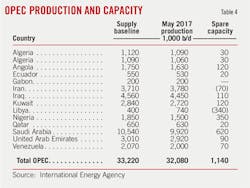
Following the cut extension, OPEC crude supply of 32 million b/d will be roughly maintained throughout year. The group's NGL output is set to average 6.8 million b/d this year compared with 6.7 million b/d a year ago.
OPEC compliance this year has been surprisingly high, averaging 97%, mainly due to Saudi Arabia and Qatar. Across non-OPEC, compliance is mixed. Compliance is strong for Russia, Oman, and Azerbaijan. Mexico is complying on structural declines.
The stabilization in prices early this year had led to rapid developments in the US oil industry, which challenges OPEC's efforts to push prices higher. Outside the US, non-OPEC production is more resilient than expected.
Canadian oil production also continues to expand. Nearly 500,000 b/d of Canadian oil sands production will be added in 2017-18, growth only exceeded by US tight oil, according to IHS Markit. Oil sands' resilience is due to falling costs in existing operations, higher utilization rates, as well as the completion of projects being constructed at the time of the price collapse.
Notably, the 150,000-b/d Hebron heavy oil project offshore Newfoundland and Labrador and Suncor Inc.'s 194,000-b/d Fort Hills mine are both expected to start production before yearend.
Brazil also is an important source of new oil supplies both this year and next. Petroleo Brasileiro SA (Petrobras) continues to bring on production in the prolific subsalt area. Three new floating production, storage, and offloading vessels, each with a capacity of 150,000 b/d, are set to start up this year, with a further five units scheduled to be delivered during 2018. In all, IEA expects Brazil's oil production to rise 190,000 b/d in 2017 and 260,000 b/d next year.
New offshore projects also will drive growth in the UK, Ghana, and Congo (Brazzaville), while output at the Kashagan project in Kazakhstan should continue ramping up towards its 370,000 b/d capacity.
In contrast, output in China, Mexico, and many other countries is expected to continue to decline as upstream investment cuts take their toll.
The outlook for Russian production remains uncertain. By early June, Russian producers had curbed production by more than 300,000 b/d from an October 2016 high to comply with the agreed cuts. At the same time, Russian producers are planning to sharply increase upstream spending this year.
OECD stocks
Although total OECD stocks have been bending lower since January, inventory draws have clearly lagged market expectations. The decline of the overhang is expected to accelerate in the second half, supported by production adjustments by OPEC and non-OPEC producers.
Total OECD commercial oil stocks in April stood at 3,045 million bbl, IEA said. At this level, OECD commercial oil stocks were higher than at yearend 2016 and 292 million bbl above the latest 5-year average. Most of the OECD surplus comes from crude oil.
Over this year's first half, weekly estimates of US commercial crude oil inventories were at their highest levels since 1986. Most of the increase in inventories this year has been because of higher imports, particularly from OPEC.
Noticeably, excluding the US, stocks are much more palatable. Of the surplus of the 5-year average, nearly 70% of the overhang stems from the US.
IEA storage data show that stocks in some key OECD oil-consuming regions outside the US have fallen. For example, weekly Japanese data suggest that crude stocks have fallen to multiyear lows.
Also, global fuel oil stocks are likely to hit their lowest level in more than 2 years due to lower Russian output and refiners switching to lighter crudes that yield more light and middle distillates.
US petroleum demand
Gasoline accounted for most growth in US fuel demand during 2015-16, but diesel will probably account for most growth in 2017-18, supported by the improved industrial backdrop.
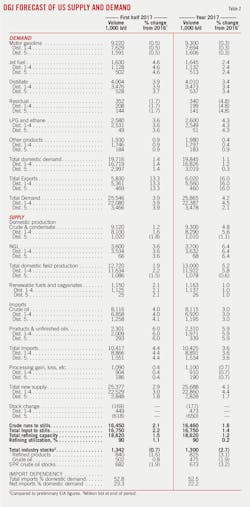
Overall, OGJ forecasts that declines in gasoline demand will be notably offset by robust growth in distillate, jet fuel, LPG, and ethane in 2017.
US gasoline demand is off to a weak start this year. According to API monthly statistics, over the first 5 months of this year, total motor gasoline deliveries dropped 0.5% from the 2016 level. However, motor gasoline demand in May was up from the prior month and the prior year, reaching 9.58 million b/d-the highest level for that month in a decade.
While gasoline demand will kick into high gear as the summer driving season picks up in the US, it will be hard to match the pace of the growth seen over recent years because of higher retail pump prices and increased fuel economy.
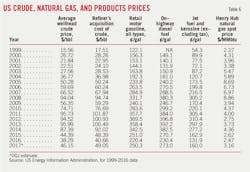
For the 2017 summer driving season, EIA forecasts US regular gasoline retail prices to average $2.46/gal vs. $2.23/gal last summer. The forecast annual average price for regular gasoline in 2017 is $2.38/gal compared with $2.15/gal in 2016.
The University of Michigan's average fuel economy estimate for new vehicles sold in the US rose in March to 25.2 mpg, up 25% from a decade ago.
US jet fuel demand has been surprisingly strong this year despite rising prices. According to OGJ estimates, demand for jet fuel in this year's first and second quarters was 1.63 million b/d, 4.6% higher than it was at the same time last year.
EIA estimates put 2017 jet fuel prices at $1.62/gal compared with $1.32/gal a year ago. Notably, US airlines have increased capacity, or number of seats, over the past 2 years, to where seat supply exceeds travel demand.
The downturn in freight movements during 2015-16 hit distillate demand especially hard. But since October 2016, the tonnage of freight movements has been increasing year-on-year because of the revival of industrial activity, oil and gas drilling, and a rise in demand for coal. This is contributing to a sharp cyclical recovery in distillate demand.
As new petrochemical capacity comes on stream, additional volumes of ethane is required.
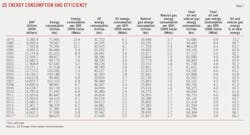
Collectively, OGJ forecasts US oil consumption will rise 1.1% to 19.8 million b/d from the year-ago level.
US oil production
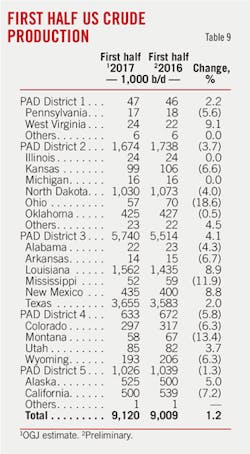
US firms have added oil rigs rapidly following the recovery in crude oil prices resulting from the supply reduction agreement put in pace last November. OGJ forecasts US crude oil production to average 9.3 million b/d in 2017, the same forecast OGJ made in January (OGJ, Jan. 2, 2017, p. 20).
Up in 23 straight weeks, Baker Hughes Inc.'s tally of active oil-directed rigs jumped to 758 by the week ended June 23, up 236 units since May 27, 2016, and its highest point since Apr. 17, 2015.
Most US onshore growth in 2017 is likely to be driven by development drilling in the Permian basin and the Eagle Ford. The Permian rig count is at its highest level since April 2015, while that in the Eagle Ford has modestly increased since October 2016.
Shale producers have become more efficient at weathering the prolonged downturn, boasting impressive productivity increases and low breakeven prices, despite signs of cost inflation. ESAI Energy LLC forecasts that US shale oil production by yearend will reach 5.6 million b/d, up more than 1 million b/d compared with the yearend 2016 average (OGJ Online, June 21, 2017).
The recent drop in prices has not yet put a brake on rising US production, as many producers through hedging have already locked in higher prices that will be produced in the coming months.
Offshore production, meanwhile, is recovering after some Gulf of Mexico operations were evacuated due to the threat of Tropical Storm Cindy.
Meanwhile, Hess Corp. plans to bring its 80,000-b/d Stampede project in the gulf on stream next year, while Chevron Corp.'s 75,000-b/d Big Foot project should also be commissioned.
Natural gas liquids output will increase to 3.7 million b/d this year from last year's 3.47 million b/d, OGJ forecasts.
Refining
US refinery runs have averaged a record high this year. Products supplied to the US market as well as exports have increased.
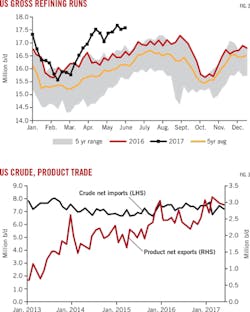
Year-to-date, gross refinery inputs were up 2%, averaging 16.75 million b/d, compared with the same period in 2016. As the summer driving seasons pick up, weekly refinery gross inputs have been higher than 17 million b/d consecutively since mid-April.
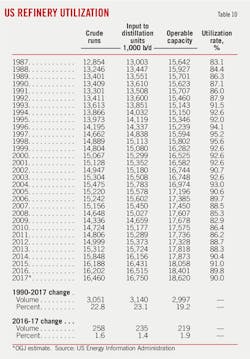
Despite record-high inputs, refinery utilization did not reach a new record because refinery capacity has increased in recent years. US refinery capacity has increased to 18.62 million b/cd from 18.4 million bc/d at yearend 2016. Averaged utilization was 90% over this year's first half.
Across all five Petroleum Administration for Defense Districts (PADD), 2016 was proven to be a worse year for refining margins than 2015 across all five PADDs because of elevated inventories. In 2017, although refining margins have remained subdued, there has been some improvements, primarily attributable to stronger distillate margins and higher West Texas Intermediate discounts relative to Brent.
According to Muse, Stancil & Co., for this year's first 5 months, the Gulf Coast and Midwest cash refining margins averaged $9.04/bbl and $9.52/bbl, respectively, down from $10.03/bbl and $9.82/bbl, respectively, over the same period last year, while East Coast and West Coast margins averaged $3.53/bbl and $16.47/bbl, respectively, up from $3.17/bbl and $13.11/bbl, respectively, a year earlier.
Imports, exports
Driven by the significant discount of US crude prices relative to global benchmarks, US crude exports have surged this year.
The costs of moving crude to the Gulf Coast has been reduced by the development of new systems such as the 520,000-b/d Dakota Access Pipeline. Also, major projects that are under way at US Gulf Coast ports will increase the region's export capacity.
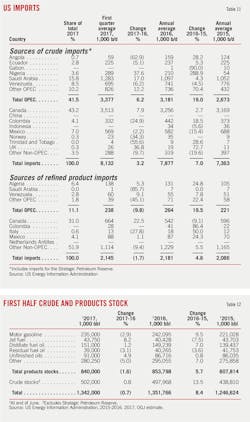
Since the crude export ban was lifted in January 2016, volumes have increase from 245,000 b/d that month. US crude oil exports averaged 520,000 b/d in 2016, 12% above the 2015 level despite a year-over-year decline in US crude oil production. So far in 2017, US crude exports have averaged 860,000 b/d, nearly 80% growth, according to OGJ estimates. In the week ended May 26, the US shipped a record 1.3 million b/d of crude oil overseas.
US exported crude oil to 26 different countries in 2016 compared with 10 countries in the previous year. While Canada remained the largest destination for US crude oil exports, its share of the total has declined.
US crude oil exports to China have been steadily rising this year. In February, China imported 9.57 million bbl of US light crude oil, overtaking Canada as the top buyer.
On the imports side, Middle Eastern crude has held strong in recent months, despite the OPEC production-cut agreement. Total waterborne imports were up 3% through April vs. year-ago levels, while imports from the Middle East were up 23%. Saudi Arabia contributed to most of the volume growth. Saudi cargoes to the US in recent months have reached 1.2 million b/d-the highest rates since 2014. However, targeted exports are expected to drop sharply since June.
Canada is still the No. 1 crude oil exporter to the US, representing about 41% of all exports in 2016 with 3.25 million b/d. During this year's first quarter, crude imports from Canada averaged 3.51 million b/d, up 7.9% from the 2016 annual average.
Export markets have been crucial to the refined product balance. OGJ forecasts US product exports to increase 13.5% this year to 5.3 million b/d.
Slowing gasoline sales at home leave US refiners increasingly dependent on exports. US gasoline exports have reached record levels of more than 700,000 b/d over the last several months. This compares with historical averages of near 500,000 b/d. Strong US gasoline exports means that refiners are no longer exclusively reliant on a strong summer driving season in the US to run down the glut of refined products.
As US demand has moderated, exports of propane also are increasing dramatically. The most popular destination of propane exports are Japan and China.
US product imports also increased from a year ago. According to monthly statistics from the American Petroleum Institute, over this year's first 5 months, product imports increased 3.6% compared with the same period a year ago. However, motor gasoline imports declined nearly 5%.
US stocks
US commercial crude stocks over this year's first half were boosted by rising US crude production and imports.
At midyear, driven by a surge in refinery runs, high exports, and less crude oil from Saudi Arabia, commercial crude stocks stood at 500 million bbl, nearly flat with the level ending the first half of 2016. This level was still well above the 5-year average.
Crude in the Strategic Petroleum Reserve (SPR) reached 680 million bbl, down from 695 million bbl a year ago. As part of its 2018 budget, the Trump administration proposed reducing by half the size of the SPR. The administration said it expects the drawdown to reduce the federal deficit by $16.6 billion, part of a package of deficit reduction measures over the next 10 years.
According to OGJ's estimates, at the close of the first half of 2017, distillate stocks were up 1.2% from a year earlier to 151 million bbl. Total gasoline stocks were down 2.9% from mid-2016 to 235 million bbl. Jet fuel was up 8.2% from year-ago levels while stocks of residual fuel oils fell 3%.
US natural gas
After averaging $2.07/MMbtu over first-half 2016, the Henry Hub natural gas spot price rose to $3.05/MMbtu in this year's first half.
With gas prices projected to rise, producers are continuing to add drilling rigs. As of June 23, the gas-directed rig count increased by 102 rigs to 183 units since the low point in August 2016. The biggest moves in the gas rig count were in the Haynesville, the Marcellus, and the Utica.
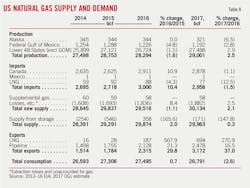
Increases in rig count and drilling efficiencies are contributing to higher gas production this year. OGJ forecasts gas production to average 79 bcfd in 2017, a 2% increase from the 2016 level, reversing last year's drop in output, the first annual decline the industry had in 11 years.
Meanwhile, projections for higher gas prices will reduce the consumption of gas for electric power generation. The US Energy Information Administration's outlook forecasts power generation from gas to fall to less than 32% of total US utility-scale generation in 2017 and 2018 from an average of 34% in 2016 because of higher gas prices. As gas's share declines, electricity produced by coal-fired units would tick up from 30% of the generation mix in 2016 to 31% in 2017 and 2018.
According to an outlook from the National Oceanic and Atmospheric Administration, most of the US is favored to have a hotter-than-average summer this year. This will contribute to increased residential and commercial gas usage.
Meanwhile, the strong growth of gas exports, including pipeline exports to Mexico and LNG, sustains continued growth in US gas prices and production.
In 2016, while the US was a net gas importer with net imports of 0.68 tcf, total US gas exports jumped 30% to 2.3 tcf from 1.8 tcf in 2015. In 2017, OGJ expects the US to become a net gas exporter with net exports of 0.2 tcf.
Most US gas imports are via pipeline from western Canada. The volume of Canadian pipeline exports to the US increased 11% in 2016 to 3 tcf, while the annual average price of Canadian gas fell 23% to $2.14/MMbtu. US importers bought more but paid less for Canadian gas last year, according to the 2016 annual trade record from the US Department of Energy.
Trade volumes grew in both directions. US pipeline exports to Canada rose 11% to 0.77 tcf last year, going to the highest-priced Canadian markets in Ontario, Quebec, and the Atlantic provinces.
Looking ahead, US gas imports from Canada are projected to continue declining. In addition, increasing amounts of gas from the Marcellus and Utica basins are expected to flow to eastern Canadian provinces.
US cross-border pipeline deliveries to Mexico rose 29% in 2016 to 3.7 bcfd from 2.9 bcfd in 2015. US gas exports to Mexico will continue to grow strongly in 2017 and 2018. Current gas pipeline export capacity to Mexico is 7.3 bcfd. Over the next 3 years this capacity will double to nearly 15 bcfd.
US LNG exports were the growth star of 2016, surging 568% to 186.8 bcf from negligible volumes in 2015. In 2016, the US-sourced gas traveled by vessels to nearly 20 countries, including China, Chile, Argentina, Egypt, India, Italy, Japan, Jordan, Mexico, South Korea, UAE, and Turkey. This compared with the fact that US LNG by vessels only reached Japan and Taiwan a year earlier. In 2017, OGJ expects US LNG exports to increase threefold to 700 bcf.
Last year, the Sabine Pass facility in Louisiana became the first operating LNG export facility in the Lower 48 states. By 2021, four LNG export facilities currently under construction are expected to be completed, expanding total operational export capacity to 9.2 bcfd. By then, LNG exports are expected to surpass pipeline exports.
LNG fetched far better prices than the pipeline gas trade with Canada and Mexico despite downward pressure due to increased supply on overseas markets. US LNG exports went for $4.55/MMbtu last year, down 39% from $7.54/MMBtu in 2015 but still nearly twice the value of US pipeline gas deliveries to Canada and Mexico.
About the Author
Conglin Xu
Managing Editor-Economics
Conglin Xu, Managing Editor-Economics, covers worldwide oil and gas market developments and macroeconomic factors, conducts analytical economic and financial research, generates estimates and forecasts, and compiles production and reserves statistics for Oil & Gas Journal. She joined OGJ in 2012 as Senior Economics Editor.
Xu holds a PhD in International Economics from the University of California at Santa Cruz. She was a Short-term Consultant at the World Bank and Summer Intern at the International Monetary Fund.
Laura Bell-Hammer
Statistics Editor
Laura Bell-Hammer is the Statistics Editor for Oil & Gas Journal, where she has led the publication’s global data coverage and analytical reporting for more than three decades. She previously served as OGJ’s Survey Editor and had contributed to Oil & Gas Financial Journal before publication ceased in 2017. Before joining OGJ, she developed her industry foundation at Vintage Petroleum in Tulsa. Laura is a graduate of Oklahoma State University with a Bachelor of Science in Business Administration.
