Pipeline materials’ cost increases lift overall construction price
Applications for new pipeline construction rebounded despite the 138% increase in material costs, itself a function of supply-chain constraints and resultant inflation.
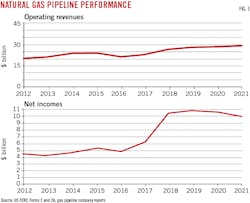
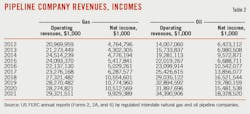
US oil and gas pipeline operators’ revenues, meanwhile, increased in 2021 as efforts to meet renewed demand increased shipments. Net incomes for liquids pipelines rose by more than 18%, reversing the rare decline experienced in 2020.
Natural gas pipeline operators’ net incomes, however, slipped for the second straight year, falling more than 5.5% (Fig. 1). These companies’ investments in additions to gas plant also dropped again, easing more than 3% as market uncertainty remained. Expenditures on operations and maintenance, however, grew more than 12%.
Property additions to liquid lines plunged more than 50% in 2021, as effects from the near halt in 2020 applications caused by the COVID-19 pandemic continued to ripple across the segment.
The rebound in oil pipeline profits caused earnings as a percent of revenue to rebound to roughly 53%. Natural gas pipeline operators’ net incomes as a share of revenue, however, continued to slide, settling to just under 34%, the lowest level since 2017.
Compression construction costs fell by more than 50%, more than reversing the 84% increase in 2021 and accompanying a more than 250% increase in proposed work to just above 500,000 hp.
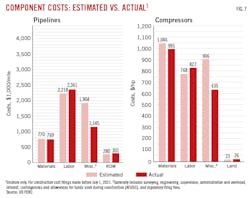
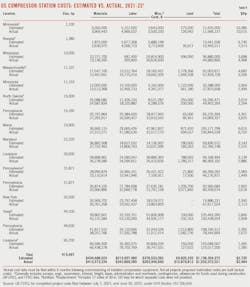
Actual land pipeline construction costs for projects completed in the 12 months ending June 30, 2022, were roughly $600,000/mile less than estimated costs, with reduced miscellaneous costs (~$750,000/mile) making the difference here as well. Actual compressor station costs were slightly less than estimated costs for the second straight year.
US pipeline data
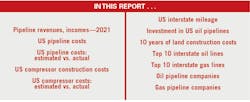
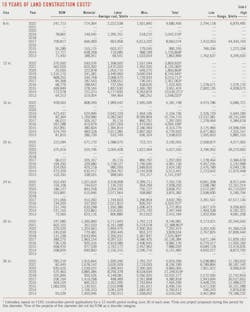
At the end of this article, two large tables (beginning on p. 42) offer a variety of data for US oil and gas pipeline companies: revenue, income, volumes transported, miles operated, and investments in physical plant. These data are gathered from annual reports filed with FERC by regulated oil and natural gas pipeline companies for the previous calendar year.
Data are also gathered from periodic filings with FERC by those regulated natural gas pipeline companies seeking approval to expand capacity. OGJ keeps a record of these filings for each 12-month period ending June 30.
Combined, these data allow an analysis of the US regulated interstate pipeline system.
- Annual reports. Companies that FERC classifies as involved in the interstate movement of oil or natural gas for a fee are jurisdictional to FERC, must apply to FERC for approval of transportation rates, and therefore must file a FERC annual report: Form 2 or 2A, respectively, for major or nonmajor natural gas pipelines; Form 6 for oil (crude or product) pipelines.
The distinction between “major” and “nonmajor” is defined by FERC and appears as a note at the end of the table listing all FERC-regulated natural gas pipeline companies for 2021 at the end of this article.
The deadline to file these reports each year is in April. For a variety of reasons, companies often miss that deadline and apply for extensions, but eventually file an annual report. That deadline and the numerous delayed filings explain why publication of this OGJ report on pipeline economics occurs later in each year. Earlier publication would exclude many companies’ information.
- Periodic reports. When a FERC-regulated natural gas pipeline company wants to modify its system, it must apply for a “certificate of public convenience and necessity.” This filing must explain in detail the planned construction, justify it, and––except in certain instances—specify what the company estimates construction will cost.
Not all applications are approved. Not all that are approved are built. But assuming a company receives its certificate and builds its infrastructure, it must—again, with some exceptions—report back to FERC how its original cost estimates compared with what it spent.
OGJ monitors these filings from July 1 to June 30 each year, collecting them, and analyzing their numbers.
Reporting changes
The number of companies required to file annual reports with FERC may change from year-to-year, with some companies becoming jurisdictional, others nonjurisdictional, and still others merging or being consolidated out of existence. Such changes require care be taken in comparing annual US petroleum and natural gas pipeline statistics.
Only major gas pipelines are required to file miles operated in a given year. The other companies may indicate miles operated but are not specifically required to do so.
Reports for 2021 show a decrease in FERC-defined major gas pipeline companies: 102 companies of 184 filing, from 104 of 182 for 2020.
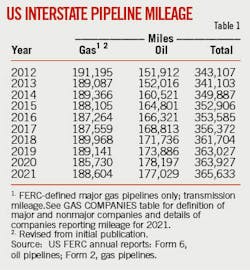
FERC-regulated major natural gas pipeline mileage grew in 2021 (Table 1), final data showing an increase of 2,874 miles, or 1.5%. Oil mileage by contrast shrank 0.7%, losing 1,168 miles.
Natural gas pipeline companies in 2021 grew revenues by roughly $1 billion (3.7%) from 2020. Net income, however, fell by more than $580 million (5.55%), accelerating the $262 million in losses experienced in 2020.
Oil pipeline earnings, meanwhile, returned to growth and recovered much of 2020’s losses, climbing more than $2.8 billion (18.4%) after falling nearly $4.3 billion the previous year. The 2020 losses had snapped a 4-year run of earnings growth. Revenues also reversed a 2020 dip, growing by almost $2.5 billion or 7.8% (Table 2).
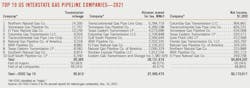
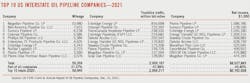
OGJ uses the FERC annual report data to rank the Top 10 pipeline companies in three categories (miles operated, trunkline traffic, and operating income) for oil pipeline companies and three categories (miles operated, gas transported for others, and net income) for natural gas pipeline companies.
Positions in these rankings shift year to year, reflecting normal fluctuations in companies’ activities and fortunes. But also, because these companies comprise such a large portion of their respective groups, the listings provide snapshots of overall industry trends and events.
For instance, earnings for the Top 10 oil pipeline companies rose 18.2% compared with the 18.4% overall increase, suggesting that the larger operators slightly lagged the industry as a whole. The Top 10 companies’ share of the segment’s total earnings shrank accordingly, standing at 43.8% vs. the 44% share of earnings held in 2020.
Net income as a portion of natural gas pipeline operating revenues eased to 34% in 2021, the third straight decline but still above the 27% posted in 2017. The percentage of income as operating revenues for oil pipelines rose to 53%, a rebound from 2020 but still below the all-time high of 60% in 2019 and other years going back to 2016.
Net income for major natural gas pipelines as a portion of gas-plant investment fell to 4.6%. Net income as a portion of investment in oil pipeline carrier property grew to 11.7%, still below 2019’s recent high of 14.3%.
Major and nonmajor natural gas pipelines in 2021 reported total gas-plant investment of roughly $219.5 billion, the highest level ever, up from $213 billion in 2020, $206 billion in 2019, $197 billion in 2018, $171 billion in 2017, $158.5 billion in 2016, $158 billon in 2015, $152 billion in 2014, about $147 billion in 2013, and more than $142 billion in 2012.
Investment in oil pipeline carrier property also continued to grow in 2021, reaching more than $156.5 billion, more than triple the values of just 10 years earlier. Carrier property in 2020 totaled $149 billion, up from $138 billion in 2019, $122 billion in 2018, $112 billion in 2017 and $99.5 billion in 2016, after reaching $93 billion in 2015, nearly $85 billion in 2014, $68 billion in 2013, topping $54 billion in 2012, and hitting roughly $49 billion in 2011.
OGJ for many years has tracked carrier-property investment by five crude oil pipeline and five products pipeline companies chosen as representative in terms of physical systems and expenditures (Table 3). In 2003, we added the base carrier-property investment to allow for comparisons among the anonymous companies.
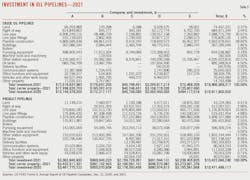
The five products pipeline companies, by contrast, saw their overall investment in carrier property slip in 2021 by more than $49 million, or 0.5%.
Comparisons of data in Table 3 with previous years must be done with caution as—in addition to reorganizations—mergers, acquisitions, and sales can make comparisons with previous years’ data difficult.
Construction plans increase
Applications to FERC by regulated interstate natural gas pipeline companies to modify certain systems must, except in certain instances, provide estimated costs of these modifications in varying degrees of detail.
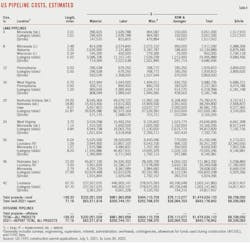
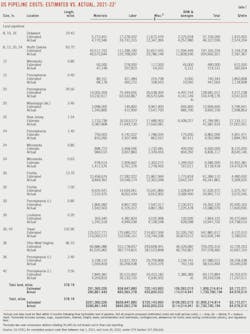
Tracking the mileage and compression horsepower applied for and the estimated costs can indicate levels of construction activity over 2-4 years. Tables 4 and 5 show companies’ estimates during the period July 1, 2021, to June 30, 2022, for what it will cost to construct a pipeline or install new or additional compression.
Not all projects proposed are approved. And not all projects approved are eventually built.
- Roughly 169 miles of pipeline were formally proposed for land construction in the 12 months ending June 30, 2022, with no offshore work submitted. The land level was a recovery from the 77 miles submitted in 2021, as capital-expenditure driven activity began to recover, but was still well below the roughly 367 miles proposed in 2020. The 246 miles proposed for land construction in 2019, were off sharply from the roughly 545 miles proposed in 2018, much less the nearly 2,500 miles proposed for land construction in 2017.
- New or additional compression proposed by the end of June 2022 exceeded 500,000 hp, up substantially from the nearly 200,000 hp proposed in 2021 and approaching the 680,000 hp proposed in 2020. Compression proposals in 2019 totaled 292,000 hp, with 287,000 hp proposed the year before.
Putting the reduced US gas pipeline construction in perspective, Table 4 lists 19 land-pipeline “spreads,” or mileage segments, and 0 marine projects, compared with:
- 9 land and 0 marine projects (OGJ, Oct. 4, 2021, p. 52).
- 18 land and 0 marine projects (OGJ, Oct. 3, 2020, p. 42).
- 18 land and 0 marine projects (OGJ, Oct. 7, 2019, p. 46).
- 11 land and 0 marine projects (OGJ, Oct. 1, 2018, p. 60).
- 27 land and 1 marine projects (OGJ, Oct. 2, 2017, p. 71).
- 33 land and 0 marine projects (OGJ, Sept. 5, 2016, p. 89).
- 46 land and 0 marine projects (OGJ, Sept. 7, 2015, p. 114).
- 31 land and 0 marine projects (OGJ, Sept. 1, 2014, p. 122).
- 26 land and 2 marine projects (OGJ, Sept. 2, 2013, p. 117).
- 11 land and 0 marine projects (OGJ, Sept. 3, 2012, p. 118).
Only one spread in 2022 measured 50 miles or more, a 42-in. OD transmission line running 67.7 miles through Louisiana.
For the 12 months ending June 30, 2022, the 19 land projects filed would cost an estimated $1.47 billion, compared with 9 land projects filed for $643 million a year earlier. Estimated construction costs rose by roughly $370,000/mile.
These statistics cover only FERC-regulated pipelines. Many other pipeline construction projects were announced in the 12 months ending June 30, 2022, but were outside FERC’s jurisdiction.
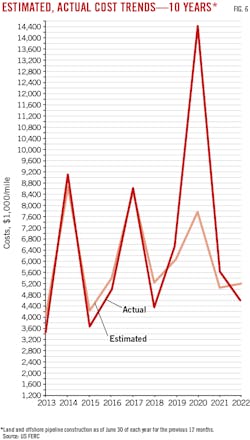
Estimated 2021-22 $/mile costs for new onshore projects as filed by operators with FERC were $8.7 million/mile. In 2020-21 the average cost was $8.3 million/mile. Cost estimate for each of the past 3 years are three of the four highest recorded, exceeded only by the $9.95 million/mile average estimates from 2017-18.
Cost components
Variations over time in the four major categories of pipeline construction costs—material, labor, miscellaneous, and right-of-way (ROW)—can also suggest trends within each group.
Materials can include line pipe, pipe coating, and cathodic protection.
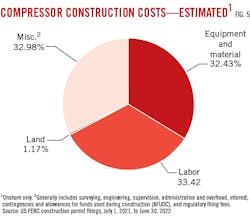
“Miscellaneous” costs generally cover surveying, engineering, supervision, contingencies, telecommunications equipment, freight, taxes, allowances for funds used during construction (AFUDC), administration and overheads, and regulatory filing fees.
ROW costs include obtaining rights-of-way and allowing for damages.
For the 19 spreads filed for in 2021-22, project cost-per-mile rose in all categories except miscellaneous, with the fall there dampening the price increases in other areas. This was a reversal from 2020-21 when all categories except miscellaneous moved lower.
In 2011 miscellaneous charges passed material to become the second most expensive cost category and in 2017 they passed labor costs to become the most expensive category of all. For the past 4 years, however, labor has reclaimed its throne:
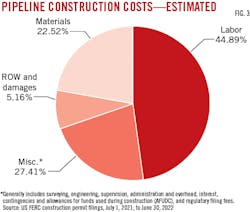
- Material—$1,960,970/mile, up sharply from $823,936/mile for 2020-21.
- Labor—$3,909,311/mile, a very slight increase from $3,897,871 for 2020-21.
- Miscellaneous—$2,386,528/mile, down significantly from the $3,276,458/mile estimated cost for 2020-21.
- ROW and damages—$449,498/mile, a large increase from the $337,818/mile cost for 2020-21.
The drop in estimated miscellaneous costs was prompted by lower contingency, administrative, and overhead estimates as pandemic-related uncertainty eased.
Table 4 lists proposed pipelines in order of increasing size (OD) and decreasing lengths within each size.
The average cost-per-mile for the projects rarely shows clear-cut trends related to either length or geographic region. In general, however, the cost-per-mile within a given diameter decreases as the number of miles rises. Lines built nearer populated areas also tend to have higher unit costs.
Additionally, road, highway, river, or channel crossings and marshy or rocky terrain each strongly affect pipeline construction costs.
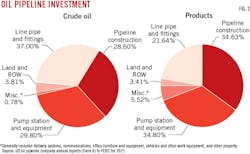
Fig. 3, derived from Table 4, shows the cost-component splits for pipeline construction.
Material costs’ portion of land pipeline costs jumped to 22.5% in 2022 from the recent low reached in 2021 of 9.9%. Labor’s share was the largest it had been since 2013, measuring 14.9% in 2020, 15% in 2019, 13.1% in 2018, 22.4% in 2017, 13% in 2016, 19.3% in 2015, 13.6% in 2014, and 23.2% in 2013.
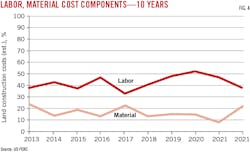
Fig. 5 shows the cost split for land compressor stations based on data in Table 5.
Completed project costs
In most instances, a natural gas pipeline company must file with FERC what it ended up spending on an approved and built project. This filing must occur within 6 months after a pipeline’s successful hydrostatic testing or a compressor’s being put in service.
Tables 7 and 8 show actual costs for pipeline and compressor projects reported to FERC during the 12 months ending June 30, 2022. Fig. 7, for the same period, depicts how total actual costs ($/mile) for each category compare with estimated costs.
If a project was reported in construction spreads in its initial filing, that’s how projects are broken out in Table 7. Completed-project cost data, however, are typically reported to FERC for an entire filing, usually but not always separating pipeline from compressor-station (or metering site) costs and lumping various diameters together.
The 12 months ending June 30, 2022, saw almost 415,500 hp completed, roughly 27% more than the year before. Actual compression costs of $2,484/hp, were 9% lower than estimates, with lower materials and miscellaneous costs more than balancing labor and land costs higher than what initially had been filed (Table 8).
Find a PDF of the pipelines here.
About the Author

Christopher E. Smith
Editor in Chief
Chris joined Oil & Gas Journal in 2005 as Pipeline Editor, having already worked for more than a decade in a variety of oil and gas industry analysis and reporting roles. He became editor-in-chief in 2019 and head of content in 2025.