Oil, gas producers navigate price volatility in first-quarter 2026

US and Canadian oil and gas producers and refiners reported first-quarter 2026 results against a sharply shifting commodity backdrop, defined above all by military action in the Middle East beginning Feb. 28 and the subsequent de facto closure of the Strait of Hormuz.
The conflict caused the single largest quarterly increase in crude oil prices on an inflation-adjusted basis since at least 1988, according to the US Energy Information Administration (EIA). Brent crude, which began January at about $61/bbl, finished the quarter at $118/bbl, with the benchmark averaging $81/bbl for the full quarter. West Texas Intermediate (WTI) moved less sharply than Brent: the Brent-WTI spread peaked at $25/bbl on Mar. 31, averaging $11/bbl in March, its widest in more than 5 years, as strong US commercial inventories and announced Strategic Petroleum Reserve (SPR) releases buffered domestic prices from the full impact of disrupted global flows.
First-quarter 2026 US crude oil production was at around 13.44 million b/d. US marketed natural gas production averaged 120.2 bcfd in first-quarter 2026, up 4% year over year. At 461.6 million bbl as of the week ending Mar. 27, 2026, US commercial crude oil inventories were 0.1% above the 5-year average for the time of year. Total motor gasoline inventories were 4% above the 5-year average, while distillate fuel inventories were about 3% below the 5-year average. Propane/propylene inventories were 71% above the 5-year average.
US refinery inputs in the first quarter exceeded the 5-year range, averaging close to 2018–20 levels, based on EIA Weekly Petroleum Status Report estimates, with refinery utilization similarly exceeding the 5-year range. High distillate prices increased refinery margins for distillate, with distillate crack spreads at New York Harbor averaging $1.42/gal in March, the highest monthly level since 2022 and well above the 2021–25 5-year average. A relatively heavy turnaround season in the autumn of 2025 helped reduce the need for scheduled maintenance in the first quarter.
Henry Hub natural gas prices were highly volatile during the quarter. The Henry Hub spot price reached a monthly average of $7.72/MMbtu in January, driven by colder-than-normal temperatures, reduced production, and large inventory withdrawals, including from Winter Storm Fern. Prices then moderated as weather normalized. At winter's end, the EIA estimated that US working natural gas in underground storage totaled 1,908 bcf, or 4% above the 5-year average. With storage rising back above the seasonal average, the Henry Hub spot price in April fell to $2.77/MMbtu.
US LNG exports reached 18.1 bcfd in March, representing the second-highest LNG export volume on record following December 2025's 18.4 bcfd. Golden Pass LNG's Train 1 exported its first cargo in late April, adding about 0.7 bcfd of export capacity.
Canadian operators reported predominantly in Canadian dollars and benefited from record oil sands production volumes during the quarter. Western Canadian Select differential behavior was shaped by the global crude dislocation, with the Brent-WTI widening also affecting domestic heavy crude realizations. Operators with integrated downstream exposure demonstrated the benefit of the captive refinery model as distillate and gasoline margins improved.
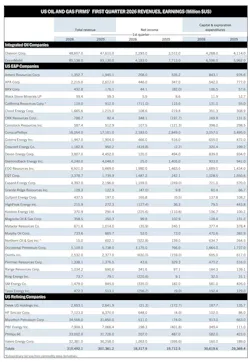
US oil and gas producers
ExxonMobil Corp. reported first-quarter 2026 earnings of $4.2 billion. Total revenues and other income were $85.14 billion, compared with $83.13 billion a year earlier. Net income attributable to ExxonMobil totaled $4.18 billion, down from $7.71 billion in the year-earlier period.
Upstream first-quarter reported earnings were $5.7 billion versus $6.8 billion in the same period last year. Energy Products swung to a $1.3 billion loss driven by large negative derivative mark-to-market impacts and Middle East supply disruptions. Chemical Products earnings were $0.1 billion while Specialty Products were broadly flat at $0.7 billion.
Net production in the first quarter reached 4.6 MMboe/d, with Guyana setting a new quarterly production record of more than 900,000 gross b/d. Permian basin production reached 1.7 MMboe/d, an increase of 250,000 b/d compared with first-quarter 2025.
Excluding external disruptions from the Middle East, Kazakhstan, and Permian winter storm effects, upstream production rose 8% year over year, attributable to growth in the Permian and Guyana. The company achieved first LNG at Golden Pass Train 1 in March, which management stated increases US LNG exports by about 5% relative to 2025. The operator expects to bring its fifth Guyana FPSO online in late 2026, adding 250,000 b/d of gross production capacity.
Cash capital expenditures totaled $6.2 billion, consistent with the company's full-year guidance range of $27–29 billion.
Chevron Corp. reported total revenues and other income of $48.61 billion for first-quarter 2026, compared with $47.61 billion a year earlier. Net income attributable to Chevron totaled $2.29 billion, down from $3.50 billion in first-quarter 2025.
Upstream earnings totaled $3.91 billion in first-quarter 2026, compared with $3.77 billion a year earlier, with US upstream contributing $2.11 billion against $1.86 billion in the year-earlier period. Downstream results were a loss of $817 million, compared with earnings of $325 million a year earlier, driven by international downstream posting a loss of $1.01 billion.
Worldwide net oil-equivalent production averaged 3.86 MMboe/d, up versus the prior-year quarter, driven largely by the acquisition of Hess, growth in the Gulf of Mexico and Permian basin, partly offset by TCO downtime and Middle East curtailments. US production exceeded 2 MMboe/d for the third consecutive quarter. US refineries achieved record crude throughput in March 2026.
Cash flow from operations excluding working capital was $7.1 billion. The company returned $6.0 billion to shareholders in the quarter, marking the 16th consecutive quarter above $5 billion in returns, comprising $3.5 billion in dividends and $2.5 billion in share repurchases.
ConocoPhillips reported first-quarter 2026 total revenues and other income of $16.05 billion, compared with $17.1 billion a year earlier. Net income was $2.18 billion versus $2.85 billion in the prior-year period.
Company-wide production averaged 2.31 MMboe/d, down 80,000 boe/d from the year-earlier quarter, as Lower 48 organic growth was more than offset by downtime, including Qatar impacts from the Middle East conflict, and higher Surmont royalties. Revenue declined primarily as weaker natural gas and NGL prices and slightly lower production offset higher oil and bitumen prices.
Cash from operating activities totaled $4.30 billion in the first quarter. Capital expenditures and investments were $2.95 billion. The company maintained its ordinary dividend of $0.84 per share.
Occidental Petroleum reported net income of $3.17 billion for first-quarter 2026, up from $766 million in first-quarter 2025. The bulk of the net income bump came from a massive $3.12 billion one-time accounting gain from the sale of the OxyChem business to Berkshire Hathaway. Adjusted income from continuing operations was $1.1 billion.
Total global production for the first quarter averaged 1.43 MMboe/d, surpassing the high end of guidance, led by contributions from the Permian, Rockies, and Gulf of Mexico business units.
Capital expenditures were $1.6 billion. Principal debt declined to $13.3 billion after $7.1 billion of repayments. Management projected second-quarter production of 1.39–1.43 MMboe/d, with full-year volumes guided to around 1.41–1.46 MMboe/d.
EOG Resources reported first-quarter 2026 total operating revenues of $6.92 billion, compared with $5.67 billion in the year-earlier quarter. Net income was $1.98 billion versus $1.46 billion a year earlier. The increase in revenue reflected higher crude oil, NGL, and natural gas production volumes, as well as a swing to net gains on mark-to-market derivative contracts from a net loss in the year-earlier period. Crude oil and condensate production averaged 548,500 b/d, up from 502,100 b/d in the same period a year earlier.
EOG raised its full-year crude oil production outlook while maintaining its capital expenditure forecast at about $6.5 billion.
Devon Energy reported net earnings of $120 million in first-quarter 2026. Core earnings, adjusting for items including a non-cash commodity derivative valuation loss of $701 million, were $641 million. Production averaged 833,000 boe/d in the first quarter, in line with guidance. Oil production averaged 387,000 b/d, representing 46% of total volumes and the high end of company guidance.
On a Devon standalone basis, second-quarter 2026 production is expected to average 851,000–868,000 boe/d. Devon noted that combined full-year guidance would be provided in mid-June 2026 following the close of its merger with Coterra Energy.
US independent refiners
Marathon Petroleum (MPC) reported first-quarter 2026 net income of $511 million, compared with a net loss of $74 million in the year-earlier quarter. On an adjusted basis, the company reported net income of $487 million. Revenue was $34.57 billion for the quarter.
Refining & Marketing segment adjusted EBITDA was $1.4 billion in first-quarter 2026, versus $489 million in first-quarter 2025. R&M margin was $17.74/bbl, compared with $13.38/bbl in the year-earlier period. Crude capacity utilization was 89%, resulting in total throughput of 2.9 million b/d.
Midstream segment adjusted EBITDA was $1.60 billion, compared with $1.72 billion a year earlier. A clean fuel production tax credit of $32 million supported results.
Refining planned turnaround costs totaled $530 million in the first quarter, compared with $454 million in the prior-year period. In the first quarter, the Garyville jet flexibility project was brought online, with modifications to the hydrocracker fractionator allowing current products to be upgraded to higher-value jet fuel.
As of Mar. 31, 2026, MPC had $2.2 billion of cash and cash equivalents and no borrowings outstanding under its $5 billion revolving credit facility. The company returned over $1.0 billion of capital to shareholders in the quarter. After quarter-end, the board of directors approved an incremental $5 billion share repurchase authorization, bringing total available repurchase authorization to $8.6 billion.
Valero Energy Corp. reported first-quarter 2026 net income of $1.3 billion, compared with a net loss of $595 million in first-quarter 2025. Total revenues rose to $32.38 billion from $30.3 billion a year earlier.
The Refining segment reported operating income of $1.8 billion for the first quarter, compared with an operating loss of $530 million for first-quarter 2025. Refining throughput volumes averaged 2.9 million b/d. Refining cash operating expenses were $5.13/bbl.
The Renewable Diesel segment reported operating income of $139 million, compared with an operating loss of $141 million in first-quarter 2025, with margin per gallon of sales increasing to $1.11 from $0.02. Ethanol segment operating income increased to $90 million from $20 million.
Valero began idling most refining process units at its Benicia refinery during the quarter, while continuing to produce gasoline as it worked down inventories. The company is progressing a $230 million fluid catalytic cracking optimization project at its St. Charles refinery expected to increase high-value product yields starting in third-quarter 2026.
Phillips 66 reported first-quarter 2026 earnings of $207 million, compared with $2.9 billion in fourth-quarter 2025. Adjusted earnings were $200 million.
The refining segment posted $208 million of net income for the quarter, versus a $937 million loss a year earlier. The refining segment operated at 95% capacity utilization with an 87% clean product yield. The company increased its annualized quarterly dividend by 7% and ended the quarter with liquidity of around $6.0 billion. Phillips 66 also formally increased Sweeny NGL fractionation capacity and Freeport LPG export dock capacity by 23% and 15%, respectively, reflecting 2025 debottlenecking activities.
HF Sinclair Corp. reported first-quarter 2026 net income of $648 million, compared with a net loss of $4 million in first-quarter 2025. Sales and other revenues rose 12% to $7.12 billion.
Refining segment income before interest and income taxes was $514 million for the first quarter, compared with a loss of $30 million a year earlier. Excluding a lower-of-cost-or-market (LCM) inventory valuation adjustment benefit of $604 million, adjusted EBITDA from refining was $55 million, compared with negative $8 million in the prior-year quarter. The improvement was principally driven by higher adjusted refinery gross margins in the West region and increased refined product sales volumes.
Renewables segment income before interest and income taxes was $182 million, compared with a loss of $39 million a year earlier. Excluding an LCM benefit of $68 million, adjusted renewables EBITDA was $133 million versus negative $17 million a year ago, attributable to increased sales volume and higher adjusted renewable gross margins tied to a narrowing BOHO spread, higher RIN prices, and producers tax credit benefits, including $49 million in prior-year credits recognized following a February 2026 proposed Treasury ruling.
For second-quarter 2026, HF Sinclair guided to refinery crude runs of 600,000–630,000 b/d, reflecting planned maintenance at Parco and Navajo and unplanned maintenance at El Dorado.
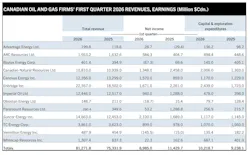
Canadian firms
All financial figures are in Canadian dollars unless otherwise noted.
Suncor Energy reported first-quarter 2026 net earnings of $2.10 billion, compared with $1.69 billion in the prior-year quarter. Adjusted operating earnings were $2.30 billion, compared with $1.63 billion a year earlier.
Adjusted funds from operations were $4.03 billion and free funds flow was $2.91 billion. Record first-quarter upstream production averaged 875,200 b/d, 22,000 b/d higher than the prior-year quarter.
Total oil sands bitumen production was 933,900 b/d, comparable to the prior-year quarter, featuring record quarterly production at Fort Hills. Net synthetic crude oil (SCO) production was 519,300 b/d with upgrader utilization of 96%, compared with 536,600 b/d and 102% in the prior-year quarter, as record quarterly SCO production at Oil Sands Base was offset by increased maintenance activities at Syncrude. Non-upgraded bitumen production increased to 279,500 b/d from 254,300 b/d a year earlier.
Refinery crude oil processed averaged 497,800 b/d, with refinery utilization at 97%. Capital expenditures were $1.08 billion. The company returned $1.54 billion to shareholders in the quarter, including around $825 million in share repurchases and over $700 million in dividends.
Cenovus Energy reported first-quarter 2026 net earnings of $1.57 billion, compared with $859 million in first-quarter 2025. The company generated $3.40 billion in adjusted funds flow and $2.20 billion in free funds flow.
Total upstream production reached a company record of 972,100 boe/d, up 19% from 818,900 boe/d in first-quarter 2025, driven by the MEG Energy acquisition and oil sands growth projects. This was Cenovus's first full quarter following the MEG acquisition. Downstream crude throughput averaged 458,500 b/d, representing a crude unit utilization rate of 97%.
Foster Creek set another quarterly production record at 223,000 b/d, with peak rates above 230,000 b/d in March. Sunrise produced just over 59,000 b/d in the quarter.
The company returned $1.00 billion to shareholders through dividends, share repurchases, and preferred share redemptions. The board approved a 10% increase in the quarterly base dividend to $0.22 per share starting in the second quarter of 2026.
Imperial Oil reported quarterly net income of $940 million, up from $492 million in fourth-quarter 2025, but below $1.29 billion in first-quarter 2025 on a reported basis. The company attributed the sequential improvement primarily to the absence of identified items and higher prices, partially offset by lower volumes.
Upstream production in the quarter averaged 419,000 gross boe/d. Kearl quarterly total gross production averaged 259,000 b/d. Cold Lake averaged 155,000 b/d. Imperial's share of Syncrude production averaged 72,000 gross b/d, impacted by unplanned coker downtime.
Downstream throughput averaged 384,000 b/d, resulting in refinery capacity utilization of 88%, compared with about 93% in the prior-year quarter. Throughput was affected by a disruption of synthetic crude feedstock caused by Syncrude's coker outage. Cash flows from operating activities were $756 million. Capital and exploration spending was $478 million. Imperial returned $350 million to shareholders through dividend payments in the quarter and declared a second-quarter dividend of $0.87 per share.
About the Author

Conglin Xu
Managing Editor-Economics
Conglin Xu, Managing Editor-Economics, covers worldwide oil and gas market developments and macroeconomic factors, conducts analytical economic and financial research, generates estimates and forecasts, and compiles production and reserves statistics for Oil & Gas Journal. She joined OGJ in 2012 as Senior Economics Editor.
Xu holds a PhD in International Economics from the University of California at Santa Cruz. She was a Short-term Consultant at the World Bank and Summer Intern at the International Monetary Fund.

Laura Bell-Hammer
Statistics Editor
Laura Bell-Hammer is the Statistics Editor for Oil & Gas Journal, where she has led the publication’s global data coverage and analytical reporting for more than three decades. She previously served as OGJ’s Survey Editor and had contributed to Oil & Gas Financial Journal before publication ceased in 2017. Before joining OGJ, she developed her industry foundation at Vintage Petroleum in Tulsa. Laura is a graduate of Oklahoma State University with a Bachelor of Science in Business Administration.