The sky’s the limit for crude prices

Oil, fundamental analysis
There aren’t enough superlatives to describe this week’s price action for crude oil after last weekend’s initial attack on Iran. Last Friday’s High for WTI pushed the $68/bbl level, which supposedly included a $3-5/bbl “risk premium” should the US attack Iran.
The general sentiment was that any attack could potentially take Iran’s 3.0 million b/d of production off the market. And there was some concern about the Strait of Hormuz.
However, when the market opened last Sunday evening, prices immediately traded $75/bbl on the Open, a $7/bbl jump from Friday’s High, indicating a risk premium more like $10–12/bbl as the market hadn’t considered Iran attacking its neighboring, oil-producing states.
Oil prices have been running higher ever since while seeking a top. WTI’s High thus far has been Friday’s $92.60/bbl, a $25 increase since last Friday, while the Low was Monday’s $69.20. Friday’s Hi/Lo range alone was over $14/bbl. The US grade has not traded that high since September 2023 when OPEC+ announced their new output cuts. Brent hit $94.65/bbl Friday with a Low of $75.75 on Monday.
Both grades are substantially higher than last week and the spread has tightened to ($2.20), the narrowest in years as WTI’s value increased as a result of the closure of the Strait of Hormuz. All other events took a back seat to the war this week. Even the Energy Information Administration's (EIA) weekly report indicating a 3.5 million bbl inventory gain was a non-event.
During a press event last Friday, President Trump expressed disappointment with the lack of progress in the US talks with Iran but said he would “give them some more time.” The next day, the US and Israel attacked Iran which, in turn, unleased on neighboring petro-states seen as being friendly to the US.
The Strait of Hormuz has been effectively blocked due to threats made by the IRGC. This has backed-up oil and LNG tankers upstream of the Strait in some cases leading to the halt of oil and LNG production given the lack of takeaway and declining storage capacity.
As the markets look for relief from the bottleneck halting about 20 million b/d, all avenues are being addressed. The Joint Maritime Information Center (JMIC) reported that only two commercial ships have passed through the Strait in the last 24 hours and those were carrying cargo. The US has now pledged US Navy escorts for ships wishing to traverse the Strait while also providing marine insurance (JP Morgan indicated that the Development Finance Corporation doesn’t have enough funding to cover all the ships that are backlogged).
OPEC+ last Sunday indicated they could provide about 250,000 b/d more in output while Saudi Arabia works to divert shipments via pipeline to its Red Sea ports. Venezuela has been increasing its exports also, but there are still not enough solutions in total to offset the volumes laying idle in the Strait let alone future exports.
The US has granted India temporary permission to resume buying crude from Russia as it has been impacted by the US' demand to cut off Urals. Other Asian countries—China, Japan, and South Korea—are being hurt as well. China has contacted Iran requesting they allow oil and LNG coming from Qatar to pass the Strait. China, however, has been stockpiling crude reserves for the past year and has continued the practice into 2026.
In the US, shale producers can’t ramp up much in the near-term. However, there are about 1,400 oil wells which have been drilled but not yet completed. The current prices could provide incentive to complete these in the next few months provided there are enough completion crews available.
And the Trump administration has thus far chosen not to draw from the Strategic Petroleum Reserve (SPR). Deliverability from the SPR would be limited to about 1.0 million b/d.
The EIA Weekly Petroleum Status Report indicated that commercial crude oil inventories for last week increased while production remained the same. The SPR held at 415 million bbl.
The US lost 92,000 jobs in February as the mass layoffs announced in January started to take effect and after a better report that month. WSJ analysts had forecasted a gain of 50,000 positions, which would have been a paltry amount anyhow. Unemployment moved higher to 4.4%. The US has experienced negative hiring numbers in 3 out of the last 6 months. The Institute for Supply Management (ISM) reported good news for the manufacturing sector last month as business activity grew to 59.9 from 57.4, services increased to 56.1 from 53.8, and new orders increased to 58.6 from 53.1. All three major US stock markets are lower on the week due to the war. The USD is down as well, which is supportive of oil prices. Gold remains well above the $5,000/oz. mark.
Oil, technical analysis
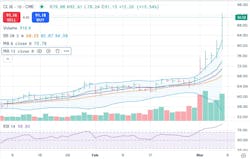
April 2026 WTI NYMEX futures shot through the Upper-Bollinger Band Limit on last Sunday evening’s Opening trades and have stayed there. Prices far exceed the 8-, 13, and 21-day Moving Averages. Volume is a new record for this contract at 916,000. The Relative Strength Indicator (RSI), a momentum indicator, is in significantly overbought territory at 89. Resistance is now pegged at $95.00 while near-term Support is $91.00.
Looking ahead
Several things have to occur for any price reversal for crude to take place. The Strait of Hormuz needs to be unblocked. If China successfully convinced Iran to allow Qatari tankers to pass, that alleviates some of the pent-up supply and markets would take that as a positive sign. If the US is successful in escorting ships through the Strait and can provide insurance coverage, so much the better.
For oil markets to calm, there msut to be a ceasefire and a restart of negotiations between the US and Iran, if possible. Should there be a halt in attacks by all sides, a total damage assessment will have to be made to determine whether there will be longer-term supply disruption both for crude and LNG.
However, the US is calling for total capitulation while the Iranian government believes it can outlast the US.
Natural gas, fundamental analysis
April NYMEX natural gas futures rose this week, but not on the scale seen with oil. Global LNG prices jumped with the Qatari output halted but mild weather forecasts for the US have capped any larger gains. Additionally, US LNG exporters are tapped out with the exception of Venture Global, which indicated it had some spot cargoes to sell.
A larger-than-forecasted storage withdrawal also added some bullishness to prices. The week’s High was Friday’s $3.30/MMbtu while the Low was Monday’s $2.90. Natural gas demand this week is estimated at 112 bcfd, while production is thought to be 110 bcfd. LNG exports held at 18.0 bcf.
In the UK, natural gas prices at the NBP were most recently $18.05/MMbtu, while Dutch TTF futures were $18.20. Asia’s JKM was quoted at $15.70/MMbtu. The EIA’s Weekly Natural Gas Storage Report indicated a withdrawal of 132 bcf vs. a forecast of -122 bcf.
Total gas in storage is now 1.886 tcf, now 6.5% above last year and 2.2% below the 5-year average.
Natural gas, technical analysis
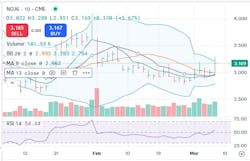
April 2026 NYMEX Henry Hub Natural Gas futures have risen to above the 8-, 13- & 20-day Moving Averages while piercing the Upper-Bollinger Band Limit. Volume around the recent average at 182,000. The RSI is now neutral at 55. Support is $3.00 with key Resistance at $3.30.
Looking ahead
With US LNG exporters maxed-out, the rising global LNG prices won’t move Henry Hub futures very much. Next week’s temperatures are seasonally mild but mid-March shows potential for some areas of demand. April26/Jan27 spreads are over $2.00/MMbtu currently, which will encourage buying April for storage.

About the Author

Tom Seng
Dr. Tom Seng is an Assistant Professor of Professional Practice in Energy at the Ralph Lowe Energy Institute, Neeley School of Business, Texas Christian University, in Fort Worth, Tex.