'Risk on' for oil prices as market plays US-Iran waiting game

Oil, fundamental analysis
Oil prices were up-and-down again this week in-sync with news emerging from the ongoing US-Iran talks. When the two sides are talking, the market has taken that as a positive development and prices soften. However, when the news from those meetings shows little sign of progress being made, the prospect of a US attack increases, and the risk premium returns. Some analysts estimate that premium is as much as $5.00-8.00/bbl, currently.
Additionally, on Friday, the US Embassy in Israel announced that non-emergency staff and their families could leave the country, citing safety risk. An unexpectedly large gain in crude inventories failed to push prices lower. The late-week rally sent prices over a key technical resistance level. WTI had a High of $67.85/bbl on Friday, which was $2.00/bbl higher than the prior week’s High.
The weekly Low of $63.60 occurred on Wednesday. Brent crude’s High was $73.00/bbl on Friday while its Low was $69.15 Wednesday. Both grades settled higher week-on-week. The WTI/Brent spread has widened to ($5.90) on the earlier week rally.
US-Iran talks are scheduled to continue next week with no real progress achieved this week which leaves the door open for speculation about a US attack over the weekend. Several US F-18 aircraft have been spotted at Israeli airbases. This possibility leads to the “Friday Effect” where traders have to carefully decide what position to take over the weekend since the market will not reopen until Sunday evening. US President Trump’s proposed deadline for a settlement agreement expires next week.
The OPEC+ group will meet this Sunday with a general expectation that they will decide to increase output at these higher price levels. Their dilemma remains one of adding barrels to an oversupplied market or holding back since the underpinning at the moment is geopolitical and not yet, physical. Saudi Arabia alone has increased its exports to 7.3 million b/d this month, up 400,000 b/d from January.
The US Treasury Department is allowing some shipments of American fuel to be shipped to Cuba to aid the humanitarian crisis there. Meanwhile, US commercial inventories of crude increased by the most in 3 years last week as a result of increased imports, decreased exports, and lower refinery utilization.
The Energy Information Administration’s (EIA) Weekly Petroleum Status Report indicated that commercial crude oil inventories for last week increased by the largest amount in 3 years. The Stretegic Petroleum Reserve (SPR) held at 415 million bbl. Total US oil production was 13.7 million b/d last week vs. 13.5 last year at this time.
Construction spending in December was +0.3%. Unemployment claims last week rose 4,000 to 212,000 vs. an expected 215,000. The Producer Price Index (PPI) rose more than expected last month coming in at +0.5% vs. a forecasted +0.3%. That resulted in a year-over-year increase of 2.9%. The PCE, the Federal Reserve’s preferred measure of inflation will be released Mar. 13 and some components of the PPI are part of that index. All 3 major US stock indexes are lower week-on-week on the inflationary growth. The USD is also lower, which is supportive of oil prices. Gold is over the $5,000/oz. mark again.
Oil, technical analysis
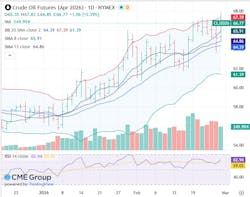
April 2026 WTI NYMEX futures are trading above the 8-, 13, and 21-day Moving Averages. Prices have pierced the Upper-Bollinger Band Limit, an overbought signal than can lead to selling. Volume is at the recent average at 340,000. The Relative Strength Indicator (RSI), a momentum indicator, is in overbought territory at 63. Resistance is now pegged at $67.50 (Upper-Bollinger Band) while near-term Support is $67.00.
Looking ahead
Should an attack on Iran by the US result in a disruption of not only their exports but other regional players, the US should have ample stocks to offset our current level of imported crude for several days. Refineries are using about 16.0 million b/d at present and we are producing just under 14.0 million b/d, most of which is the lighter shale oil. In addition to curtailing crude exports, commercial storage at 436 million bbl can provide about 70 days’ worth of the present import amounts. And, at 715 million bbl, the SPR could provide an additional 120 days of feedstock at current input levels.
Naturally, as we approach the summer driving season, refinery inputs will build up to around 18 million b/d, shrinking the days of supply available.
Natural gas, fundamental analysis
April NYMEX natural gas futures fell this week on warmer weather and a modest storage withdrawal for this time of year despite the cold that hit the Northeast. The week’s High was Tuesday’s $3.15/MMbtu while the Low was Friday’s $2.78. Natural gas demand this week has been estimated at up to 121 bcfd while production was thought to be 106 bcfd.
LNG exports held at 18.0 bcf. In the UK, natural gas prices at the NBP were most recently at $10.75/MMbtu while Dutch TTF futures were $11.25. Asia’s JKM was quoted at $10.75/MMbtu. The EIA’s Weekly Natural Gas Storage Report indicated a withdrawal of 52 bcf vs. a forecast of -60 bcf. Total gas in storage is now 2.018 tcf, 7.5% above last year and 0.3% below the 5-year average.
Natural gas, technical analysis
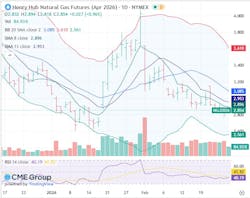
April 2026 NYMEX Henry Hub Natural Gas futures have fallen to below the 8-, 13, and 20-day Moving Averages. Volume was below average at 85,000. The RSI is now oversold at 40. Support is $2.80 (week’s Low) with key Resistance at $2.90 (8-day MA).
Looking ahead
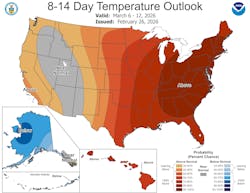
There has been a rapid warm-up for most of the country and the 8-to-14-day forecast looks bearish for natural gas demand. April is a shoulder demand month but also the first month of the traditional reinjection cycle which may lend a floor to prices. LNG exports remain steady as international prices stay well-above Henry Hub.
About the Author

Tom Seng
Dr. Tom Seng is an Assistant Professor of Professional Practice in Energy at the Ralph Lowe Energy Institute, Neeley School of Business, Texas Christian University, in Fort Worth, Tex.