Oil prices slip on technicals and easing of supply
Oil, fundamental analysis
Last week’s “too high, too fast” rally ran into headwinds this week on optimism regarding disrupted Saudi Arabia supplies. Additionally, a key technical indicator was breached signaling prices had moved considerably north of their recent average. WTI’s High was Tuesday’s $107.75/bbl for October while the Low was Friday’s $99.10. October Brent crude hit its High on Friday at $109.80/bbl with the low on Thursday at $101.55. WTI is higher on the week, matching levels not seen since mid-May while Brent is slightly lower than last Friday. The WTI/Brent spread has now tightened to $4.05.
Saudi Arabia is assessing the damage to its East-West pipeline. While some operations may resume, the kingdom estimates a return to full capacity could take 6-8 weeks barring further attacks by Iran. In the meantime, officials are considering use of ship-to-ship transfers and US Navy escorts to move some oil past the Strait of Hormuz on the southern end near Oman. That announced strategy helped put a cap on the rally that started last week.
Meanwhile, Iranian leadership has now allegedly stated that the Strait of Hormuz will not be opened 100% until President Trump leaves office in January 2029. Tanker tracker Kpler estimated that about 10 million b/d did make it through the strait this past week but that is still down from the 17-20 million b/d pre-war level. Offsetting the large decline in oil supplies, the International Energy Agency (IEA) has reduced the 2026 demand picture by 2.5 million b/d, the largest crude demand destruction since the 2020 pandemic and the second worst in 60 years’ time.
It was widely known that last year, China continued to stockpile oil for reserve purposes which served to hold prices higher than they may have otherwise been. That, along with a continued diversification of their energy portfolio, allowed China to purchase about 23% less oil during the Iran War thus far. This, too, has helped keep a lid on global oil prices with Goldman Sachs analysts estimating about a $10/bbl lower impact. China has also expanded its refining capacity which has helped temper refined product prices as well.
The Energy Information Administration’s (EIA) Weekly Petroleum Status Report indicated that commercial crude oil inventories for last week decreased while production held at 13.9 million b/d vs. 13.4 last year. The Strategic Petroleum Reserve (SPR) was down 0.2 million bbl to 285 million bbl (the lowest level since 1982).
US exploration and production company, Continental Resources announced an MoU with PDVSA to develop a major oil block in the Oronoco Belt in Venezuela. Continental has been the major player in the Bakken Shale in North Dakota.
The US Federal Reserve made a move Wednesday to curb inflation by raising interest rates by 0.25%, the first increase in 3 years’ time. Further increases are expected should inflation not recede as a result of this action. However, unless energy prices subside, it’s highly likely that both the CPI and PCE will not decline. Additionally, analysts are now pointing to the rising cost of microchips as impacting the cost of consumer electronics as hyper scaling datacenter builders compete over a dwindling supply.
US industrial production held flat from July to August while analysts expected a 0.3% increase. Pending home sales increased slightly last month while new housing starts dropped. Manufacturing output declined 0.3% with the production of durable goods down 0.5%. However, all 3 major US stock indexes were lower week-on-week. The USD is only slightly lower on the week as is gold. Retails sales for August rose 1.2% vs. an expected +0.8%. The Dow and S&P are lower week-on-week while the tech-heavy NASDAQ is higher.
Oil, technical analysis
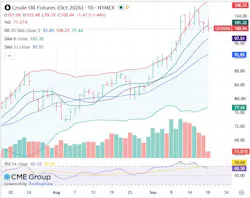
October WTI NYMEX futures last week broke above the Upper-Bollinger Band limit representing a move that is 2 Standard Deviations from the 20-day Moving Average (MA). That was a key signal that the market was overbought and was part of the reason for the decline this week as evidenced in the chart.
Prices have retreated to the area around the 8-day Moving Average but are still above the 10- and 20-day MAs. Volume is below the recent average at 75,000 as traders turn their attention to November with October expiring next Tuesday.
The Relative Strength Indicator (RSI), a momentum indicator, is still overbought at 65. Resistance is now pegged at $100.50 while near-term Support is $99.10 (Thursday’s Low).
Looking ahead
It’s hard to tell if Iran is becoming more desperate as they suffer economic pressures or if they are serious with their new, longer-term stance on this conflict especially, with regard to the Strait of Hormuz. There appear to have been no diplomatic talks this past week. Certainly, the addition of the Yemeni-based Houthis as an ally has strengthened Iran’s position in the region. Markets will be looking for progress on the repairs of the East-West pipeline as well as the success of ship-to-ship transfers. In the US, the post summer peak demand season is already being seen in the reduced refinery utilization this week. Production of diesel will likely remain high, however. As we move towards fall weather, sustained high diesel prices will translate into high heating oil prices which will impact the US from Washington, DC, to Boston.
Natural gas , fundamental analysis
October NYMEX Henry Hub Natural Gas futures moved higher this week on extended summer heat, and a slightly lower-than-forecasted storage injection was reported. The week’s High was Wednesday’s $2.98/MMbtu while the Low was Friday’s $2.85. Natural gas demand this week has been estimated at about 70 bcfd with a large drop in power generation while supply was thought to be 113 bcfd. LNG exports were 18.7 bcf while exports to Mexico were 7.3 bcfd. In the UK, natural gas prices at the NBP were most recently a little lower at $26.30/MMbtu. Dutch TTF futures were also lower at $25.75/MMbtu. Asia’s JKM was quoted at $25.20/MMbtu as Asian and European markets are essentially competing for the same shipments. (Qatar was able to move a handful of LNG cargoes through the Strait of Hormuz this week by also using the ship-to-ship transfer system.)
The EIA’s Weekly Natural Gas Storage Report indicated an injection of 44 bcf vs. a forecast of +49 and a 5-year average of +74 bcf. Total gas in storage is now 3.298 tcf, 3.6% below last year and 3.7% above the 5-year average.
Natural gas, technical analysis
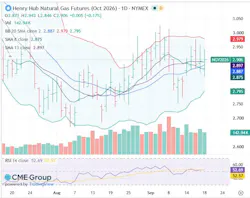
October 2026 NYMEX Henry Hub Natural Gas futures are encompassing the 8-, 13-, 20-day Moving Averages. Volume is about the recent average at 145,000. The RSI is neutral at 52. Support is $2.85 with Resistance at $3.00.
Looking ahead
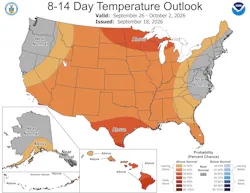
LNG exporter, Caturus, plans to expand its Commonwealth LNG plant in Cameron Parish, La., by 5 new trains after reaching long-term agreements with several buyers. Heading into the last part of September, temperatures are predicted to moderate with extreme South Texas remaining above-normal.
The storage surplus above the 5-year average is shrinking so we need to see continuing increases in weekly injections. There are only 7 weeks remaining in the storage injection cycle.
About the Author
 Tom Seng
Tom Seng
Dr. Tom Seng is an Assistant Professor of Professional Practice in Energy at the Ralph Lowe Energy Institute, Neeley School of Business, Texas Christian University, in Fort Worth, Tex.