Oil prices fall as traders go all-in on peace plan
Oil, fundamental analysis
Despite the “saber rattling” and quick reversal by President Trump regarding Iran, oil markets were decidedly bearish this week even though an actual peace plan has not been agreed to by both parties. Another large draw in both commercial inventories and the SPR failed to provide price support. Both major grades of crude fell below the key $90/bbl mark. WTI’s high was Monday, June 8’s $95.50/bbl for July while the low was Friday’s $83.20. Brent crude hit its high on Monday at $98.10/bbl with the low on Friday at $85.80. Both grades settled lower while the WTI/Brent spread tightened to ($2.30) which could make exports to Europe uneconomical.
An exchange of hostilities continued this past week with Israel attacking Lebanon leading to Iran hitting neighboring states and Israel itself. Iran also threatened to take control of the Bab al-Mandab Strait, the only entry point for the Red Sea. In turn, the US reengaged with specific Iranian targets and President Trump proposed an escalation should Iran not come to terms on a peace agreement to end the war. He indicated that Kharg Island, Iran’s key oil export site, would be a target.
A day later, Trump stated that there was now a detailed peace plan agreed to by several regional countries which was signed-off on by Iranian leadership. It was reported that the impacted regional countries had contacted the White House and asked that the US not ramp-up military actions. Once again, Iran’s Foreign Ministry stated no such agreement was in place. Negotiators in Pakistan have indicated that the Islamic Revolutionary Guard Council will have tremendous influence on any settlement agreement.
The US naval blockade will remain active until a resolution of the war is reached, and Iran continues to control the Strait of Hormuz while indicating that any peace agreement would not include a full opening of the Strait. Iran has even suggested that it would operate it in conjunction with Oman and continue to charge tolls. While we do know that oil tankers have be able to pass through Hormuz, there are wide ranges of actual numbers being reported.
President Trump has claimed that the US Navy has escorted the equivalent of 100 million bbl of oil with tankers that have turned off both their transponders and lights as well as executing some ship-to-ship transfers to hide the source of the oil. Tanker-tracking firms have put the number closer to about 30 ships/day including cargoes compared with more than 3,000/day before the war. Iran has allowed passage for ships paying a toll as well as, those from friendly countries such as China and India.
Strategic reserves of global oil continue to decline which will eventually impact the back end of the price curve as replenishment plans emerge. The US Energy Information Administration (EIA) has reported that the world’s stockpiles have been heading towards their lowest levels since 2003 when they first started records. Meanwhile, China appears to be in a solid position with an estimated 1.0-1.5 billion bbl.of inventory which could easily sustain it for the next several months. Its crude imports for May were down 100 million bbl from April. And OPEC has again lowered its forecast for demand growth this year to 970,000 b/d, down 200,000 b/d. from last month’s projection. In the interim, OPEC+ group has agreed to increase output in July by 188,000 b/d.
EIA’s Weekly Petroleum Status Report indicated that commercial crude oil inventories for last week decreased 7.3 million bbl to 426.5 million bbl, the 7th-straight decline. The Strategic Petroleum Reserves was 7.9 million bbl to 349 million bbl. US production last week was 13.8 million b/d (matching last November’s record high) vs. 13.7 million b/d last week and 13.4 million b/d a year ago.
Inflation rose again in May to +4.2%, up from April’s +3.8% largely on increased energy costs. “Core” inflation rose +2.9% vs. April’s +2.8%. In addition to the CPI reading, the PPI was also higher last month coming in at +1.1% over April and +6.5% year-on-year vs. an expected +6.4%. Despite these negative indicators, all (3) major US stock indexes are higher week-on-week as the SpaceX IPO and optimism regarding a US/Iran peace accord has fueled a rally. The Dow remains above 51k. The USD is lower on the inflationary news, however. Gold is also lower with the move into equities.
Oil, technical analysis
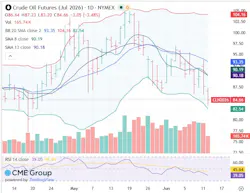
July WTI NYMEX futures have below the 8-, 13- and 20-day Moving Averages with Friday’s Low approaching the Lower-Bollinger Band limit. Volume is below the recent average at 166,000. The Relative Strength Indicator (RSI), a momentum indicator, is oversold at 39. Resistance is now pegged at $85.75 (Thursday’s Low) while near-term Support is $82.55 (Lower-Bollinger Band). Despite the optimism in the market currently, traders still need to take cautious positions ahead of the weekend since the status of a and peace accord are still unknown.
Looking ahead
The continuation of “We said/They said” in the peace negotiations will only continue to fuel the volatility in oil prices. Both sides will need to almost simultaneously announce that an acceptable accord has been reached and that approvals from both sides are, in fact, pending. Should that actually occur, the focus immediately returns to the future of operation of the Strait of Hormuz, the detailed on-the-ground assessment of energy infrastructure damage and solid estimates of the length of time needed to restore strategic reserves to their pre-war levels. There are now more oil and gas rigs running in the US vs. last year at this time as some E&P companies take advantage of the higher market price environment.
Natural gas, fundamental analysis
The July NYMEX natural gas futures were lower this week on lower-than-expected temperatures and a higher-than-expected storage injection. The week’s High was Wednesday’s $3.25/MMbtu while the Low was Tuesday’s $3.05. Natural gas demand during the week has been estimated at about 93 bcfd on increased power consumption and LNG exports while supply was thought to be 112 bcfd. Inputs to LNG export polants were back up to 17 bcf. Exports to Mexico were 7.0 bcfd.
In the UK, natural gas prices at the NBP were most recently lower at $14.95/MMbtu. Dutch TTF futures were also higher at $16.80/MMbtu. Asia’s JKM was quoted at $18.90/MMbtu as Asian and European markets are essentially competing for the same shipments. August deliveries have reached $19.20/MMbtu on record heat tied to this year’s 'Super El Nino' event. The EIA’s Weekly Natural Gas Storage Report indicated an injection of 108 bcf vs. a forecast of +100 and a 5-year average of +95 bcf. Total gas in storage is now 2.686 tcf, reaching -0.2% above last year and 6.0% above the 5-year average.
Natural gas, technical analysis
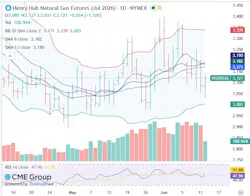
July 2026 NYMEX Henry Hub Natural Gas futures have fallen below the 13- and 20-day Moving Averages. Volume is below the recent average at 100,000. The RSI is neutral at 48. Critical Support is $3.00 with Resistance at $3.15.
Looking ahead
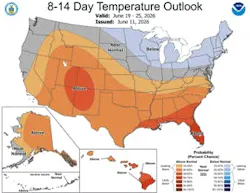
The 8-14-day forecast indicates that the southern half of the country will experience seasonal to above-normal summer temperatures. Repeated storm fronts have kept a cap on high temperatures thus far in June. However, summer is here so expect rising temperatures and an increase in gas-fired power generation which should lead to lower storage injections as well.
About the Author

Tom Seng
Dr. Tom Seng is an Assistant Professor of Professional Practice in Energy at the Ralph Lowe Energy Institute, Neeley School of Business, Texas Christian University, in Fort Worth, Tex.