The Hormuz yo-yo continues for oil prices

Oil, fundamental analysis
Oil prices were mostly lower this week as the June NYMEX WTI contract settled Tuesday at $107.80 while July became the “prompt month” on Wednesday but closed lower at $98.25 on “the roll”. US President Trump’s threats to Iran once again started the week on a bullish note but a conciliatory tone later pushed oil lower. A large inventory draw in the US, both commercial and the Strategic Petroleum Reserve (SPR), only added to global reserve concerns. However, some shipments of crude have been able to pass through the Strait of Hormuz. WTI’s high was Monday’s $109.50/bbl for June while the Low was Friday’s $95.50 for July. Brent crude hit its high on Monday at $112.70/bbl with the low on Friday at $102.25. Both grades settled lower than last week, and the WTI/Brent spread has now widened to ($6.60).
Pres. Trump had warned Iran that “the clock is ticking” for them to reach an agreement and indicated a major assault would be the consequence for non-action on their part. However, he would reverse that stance after speaking to allies in the region who were concerned about retaliatory attacks by Iran. A major point of contention in reaching an agreement is the disposition of Iran’s already enriched uranium stockpile. While the US insists it be removed, the current Ayatollah has ordered that it remain in Iran. Mediators from both Pakistan and Qatar are talking with Tehran in the hopes of gaining some kind of concessions from Iran. With the US naval blockade, observers believe Iran will eventually run out of crude storage capacity and have to shut-in its oil fields which would be crippling to its economy. No one appears to have any estimates on just how long this might take, however.
Meanwhile, the US has again extended its waiver of sanctions on “stranded” Russian oil that is already onboard tankers in international waters. China has been said to be a key buyer of these cargoes. And shipments of Persian Gulf oil are moving passed the Strait of Hormuz as some countries come to an agreement with the IRGC. At least three supertankers were allowed passage this week with about 8.0 million bbl in total cargoes. Saudi Arabia’s crude exports, enabled by their East-West pipeline, have slipped to just under 4.0 million b/d. as demand in Asia is declining in part, due to lower refinery runs there and China preferring to draw from its strategic reserves.
In the US alone, the combined crude inventory draw for last week from commercial inventories and from the SPR was a record 17.8 million bbl. Commercial stocks alone have fallen by 25 million bbl in the last 2 months, effectively wiping out gains from the early part of the year. Additionally, the SPR draws totaled 18.5 million bbl over just the past 2 weeks, a record 2-week amount. Also, the International Energy Agency (IEA) is reporting that an average of 2.5-3.0 million b/d of global reserves is flowing into the market, but the amount is far less than the estimated 14% of supplies disrupted by the closure of the Strait of Hormuz. The agency is warning that a prolonged supply shortage lasting into the mid-summer travel season could be devastating for the global economy. ADNOC (UAE) officials are also concerned that the market does not accurately represent the long-term impacts of the current situation, believing that a return to pre-war conditions in the Persian Gulf region may not occur until well into 2027 and that’s only if the Strait of Hormuz is opened fully in the near future.
The Energy Information Administration’s (EIA) Weekly Petroleum Status Report indicated that commercial crude oil inventories for last week decreased while supply was unchanged. The SPR was -9.9 million bbl to 374 million bl.
All markets are watching oil prices as the dominant factor in how the global economy ebbs and flows. Given the ultimate list of petroleum-derived products, the feedstock cost is wide-reaching. Energy prices continue to fuel inflation concerns this week as the Fed may have to actually raise interest rates instead of any reductions. Additionally, US Treasury yields continued to rise increasing borrowing costs as well as, the interest on US debt. Mortgage rates rose this week to a 9-month high of 6.51% on the standard 30-year loan. Unemployment claims did decline last week to 209,000, below a forecasted 213,000. Despite some negative signs, all 3 major US stock indexes are higher week-on-week with the Dow breaking over the 50,000 mark again while the S&P continues its streak of weekly gains and the NASDAQ settles higher. The USD is about the same as last week while gold is slightly lower.
Oil, technical analysis
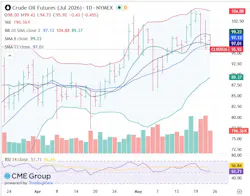
July WTI NYMEX futures have moved back down to the 8-, 13, and 20-day Moving Averages. Volume is at about the recent average at 200,000. The Relative Strength Indicator (RSI), a momentum indicator, is neutral at 52. Resistance is now pegged at $99.50 while near-term Support is $94.75. As has been the pattern for several weeks now, traders have to be cautious with their Friday positions as the market is closed until Monday evening the long holiday weekend.
Looking ahead
Clarity on the US/Iran negotiations has been lacking for weeks now and next week doesn’t look to change that. These huge draws from global inventories will come back to bite the market if something doesn’t change soon. US refinery utilization will increase in the coming weeks while we are exporting record volumes of crude. Concerns are emerging over the supply of motor oil which is also raising the price of routine maintenance for consumers at a time when mpg is critical. Look for more tankers to be granted passage as the IRGC works with friendly countries.
Natural gas, fundamental analysis
June NYMEX natural gas futures are lower this week on a larger-than-expected storage injection and mild weather. The week’s High was Friday’s $2.98/MMbtu while the Low was Monday’s $2.75. Natural gas demand this week has been estimated at about 93-96 bcfd while production was thought to be 106-107 bcfd. Inputs to LNG export plants were down somewhat on maintenance issues and ranged from 18-19 bcfd. Exports to Mexico were 7.0 bcfd. In the UK, natural gas prices at the NBP were most recently lower at $15.75/MMbtu. Dutch TTF futures were also lower at $16.65/MMbtu. Asia’s JKM was quoted at $18.90/MMbtu as Asian and European markets are essentially competing for the same shipments. Some European buyers of natural gas for storage are balking at current price levels which exceed those of next winter. The EIA’s Weekly Natural Gas Storage Report indicated an injection of 101 bcf vs. a forecast of +95 and a 5-year average of +92 bcf. Total gas in storage is now 2.391 tcf, now at +1.4% above last year and 6.6% above the 5-year average.
Natural gas, technical analysis
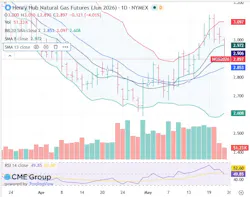
June 2026 NYMEX Henry Hub Natural Gas futures stayed above the 13- and 20-day Moving Averages this week with Friday’s High and Close breaching the Upper-Bollinger Band Limit. Volume is around the recent average at 120,000. The RSI is neutral at 58. Support is $2.85 (8-day MA) with key Resistance at $3.00 (Bollinger Band).
Looking ahead
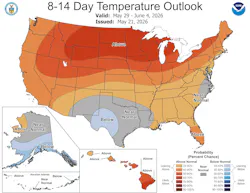
Glenfarne’s Alaska LNG project signed a 30-year supply deal with ConocoPhillips this week for North Slope gas. Additionally, they have secured agreements which will enable them to get an FID for the total pipeline and LNG production/export infrastructure. Phillips 66 announced its 300 Mcfd Zeus processing plant project for the Permian basin which will help capture the associated natural gas that would otherwise be vented. The 8-14-day forecast could bring some increased power demand as norma” temperatures for late May/early June are warmer.
About the Author

Tom Seng
Dr. Tom Seng is an Assistant Professor of Professional Practice in Energy at the Ralph Lowe Energy Institute, Neeley School of Business, Texas Christian University, in Fort Worth, Tex.