From Strait of Hormuz disruption to energy market realignment

The global oil market has entered one of its most volatile periods in decades as the conflict involving Iran, Israel, and the US evolves into a broader systemic energy shock. The disruption of flows through the Strait of Hormuz—which previously handled nearly 20% of global oil supply, roughly one-quarter of worldwide seaborne oil trade, and about one-fifth of global LNG trade—has triggered severe supply losses, refinery disruptions, freight dislocations, inflationary pressures, and heightened market volatility. The crisis is unfolding amid an already fragmented global environment shaped by sanctions, supply-chain realignment, and intensifying competition over energy security.
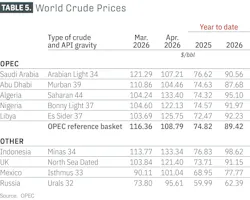
With the Strait of Hormuz effectively closed and US-Iran tensions still unresolved at the time of writing, global energy markets remained highly volatile and deeply uncertain. Rising supply disruptions are drawing down global oil inventories at an unprecedented rate. Brent crude prices averaged $117/bbl in April, up $46/bbl from February and marking the highest monthly average since June 2022 following Russia’s invasion of Ukraine.
The Strait of Hormuz, the world’s most important energy chokepoint, serves as the primary export route for crude oil, refined products, and LNG from Saudi Arabia, Iraq, Kuwait, the UAE, Qatar, and Iran. In 2025, about 18.2 million b/d of crude oil and refined products moved through the corridor. Asian economies remained especially exposed, accounting for nearly 80% of Hormuz oil flows. China imported nearly 5 million b/d through the strait, while India, Japan, and South Korea each imported roughly 2 million b/d.
For decades, global oil markets assumed the Strait of Hormuz would remain open even during periods of severe geopolitical tension. During the Iran-Iraq “Tanker War” of the 1980s, attacks on shipping raised freight and insurance costs, but Gulf oil exports continued flowing through the corridor. That experience reinforced confidence in the resilience of global energy trade. However, the 2026 crisis has upended that assumption, highlighting that uninterrupted flows through the strait can no longer be taken for granted.
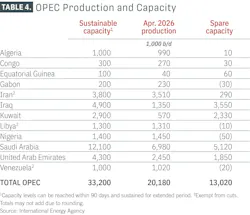
The interruption of Hormuz flows rapidly evolved into one of the largest supply disruptions in modern oil market history. According to estimates from the US Energy Information Administration (EIA), crude oil production shut-ins in the Middle East averaged an estimated 10.5 million b/d in April and are expected to peak at nearly 10.8 million b/d in May as storage capacity constraints force producers to curtail additional output. Expectations for higher shut-in volumes also reflect expectations that Iran will reduce production as the US blockade limits its ability to export crude oil.
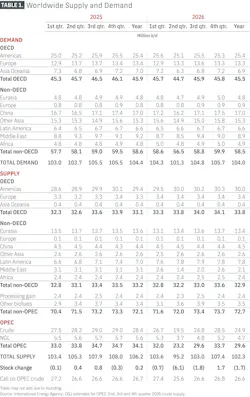
Separate estimates from the International Energy Agency (IEA) indicate that global oil supply has fallen by an unprecedented 12.8 million b/d since the outbreak of the conflict, after declining an additional 1.8 million b/d month over month (m-o-m) in April to 95.1 million b/d. OPEC+ production dropped by 1.9 million b/d from March to 40.1 million b/d in April, leaving output 11.9 million b/d below pre-war levels, while OPEC production fell to its lowest level in decades. Non-OPEC+ supply increased by 90,000 b/d m-o-m to 54.9 million b/d in April from the March low, but remained 820,000 b/d below pre-conflict levels due to substantial production losses in Qatar following Iranian attacks on its infrastructure.
The countries most severely affected were those lacking sufficient bypass infrastructure. While Saudi Arabia and the UAE retained some ability to redirect exports through alternative pipeline systems bypassing Hormuz, including Saudi Arabia’s East-West pipeline to the Red Sea and the UAE’s Fujairah export route, these systems could only partially compensate for the lost export capacity.
Iranian attacks on infrastructure in Saudi Arabia, Kuwait, Bahrain, and the UAE have further complicated the outlook for restoring production capacity and have sparked concerns that a portion of the Gulf region's output may remain impaired for an extended period. Market attention has now shifted from merely quantifying the volume of lost barrels to assessing the time required to restore production capacity—and whether some of that capacity may have sustained permanent damage.
Meantime, as prompt cargoes became scarce, physical shortages caused sharp dislocations between paper and physical markets, widening Dated Brent premiums over front-month ICE Brent futures and creating losses for traders relying on physical crude to hedge paper positions. At the same time, liquidity in Dubai-linked futures markets reportedly deteriorated, highlighting how geopolitical disruptions now spread rapidly through both physical supply chains and financial market structures.
OPEC+
In an unexpected statement on Apr. 28, the UAE announced its withdrawal from OPEC, effective May 1. 2026. The UAE’s departure reflects deeper tensions that have existed within OPEC for years, particularly regarding baseline production quotas and long-term capacity expansion plans. Abu Dhabi has invested heavily in expanding upstream production capacity and increasingly sought greater autonomy over output decisions. By exiting the organization, the UAE gains the ability to align production directly with market conditions and national revenue objectives rather than collective targets established by the group.
Although the immediate market impact remains constrained because Hormuz disruptions continue limiting Gulf exports, the UAE’s withdrawal introduces greater uncertainty into the long-term structure of global oil supply management. The move may weaken cohesion within OPEC+, complicate future negotiations, and contribute to a less coordinated producer landscape. Over time, this could increase oil price volatility and shift greater balancing responsibility toward non-OPEC producers, particularly US shale operators.
The rapid expansion of non-OPEC crude production, combined with growing internal fragmentation within OPEC, has steadily eroded the group’s influence over the global oil market. OPEC’s share of global crude output has declined to around 36%, far below the more than 50% share it held during the 1970s. Withdrawal of UAE production capacity from the alliance would further weaken OPEC’s ability to influence global oil prices and maintain market discipline.
Among OPEC+, Russia emerged as one of the major indirect beneficiaries of the crisis. Higher global oil prices boosted Russian export revenues, while some buyers increased purchases of Russian crude despite ongoing sanctions. In an effort to stabilize global energy markets amid the Middle East disruption, the US Treasury issued a temporary 30-day waiver in March authorizing the delivery and sale of certain Russian-origin crude oil and petroleum products that had already been loaded onto vessels by Mar. 12, 2026. The waiver, which initially expired on Apr. 11 and excluded transactions involving Iran, was later temporarily extended. However, continued Ukrainian attacks on Baltic Sea and Black Sea ports at current levels could create additional downside risks for production forecasts in Russia and Kazakhstan.
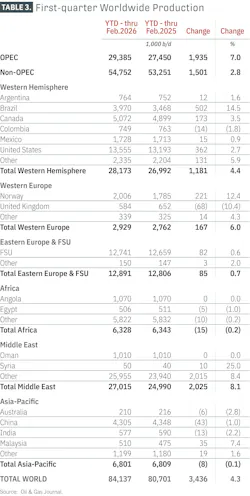
Venezuela’s crude production rose to about 1 million b/d in April, while exports climbed to their highest level since 2019 as India increased purchases to offset lost Middle Eastern supply. The recovery was supported by policy reforms and changes to US licensing rules, which enabled companies including Chevron and Repsol to expand operations and investment in Venezuela’s oil sector. Oilfield service companies linked to SLB, Halliburton, Baker Hughes, and Weatherford reportedly began redeploying rigs and equipment.
Demand destruction
The burden of market adjustment quickly shifts toward demand destruction, as surging oil prices curb consumption and help rebalance global oil markets. In regions facing fuel shortages, governments and companies are implementing measures to reduce oil consumption and contain the crisis, including demand-saving policies, price controls, and even 4-day work weeks.
According to IEA’s latest forecast, global oil demand is now projected to fall by 2.45 million b/d year over year in second-quarter 2026, with full-year demand expected to decline by 420,000 b/d—about 1.3 million b/d below pre-conflict forecasts. Oil demand in non-OECD countries is projected to decline by 70,000 b/d in 2026. This forecast assumes that an agreement to end the conflict is reached, allowing oil flows through the Strait of Hormuz to gradually resume beginning in third-quarter 2026.
The sharpest reductions have emerged in the petrochemical sector, where tightening feedstock supplies from the Middle East are increasingly constraining operations. LPG/ethane and naphtha account for roughly half of the downgrade to 2026 oil demand forecasts compared with pre-conflict levels, equivalent to an average reduction of about 700,000 b/d, with the sharpest declines occurring in second-quarter 2026.
Jet fuel and kerosene demand have also been heavily affected, falling by 210,000 b/d from pre-conflict expectations. Aviation activity has also remained significantly below normal levels, helping to partially relieve pressure on jet fuel markets after prices nearly tripled following the disruption of Middle Eastern exports.
So far, the impact of the conflict on road transportation fuel demand has remained relatively limited and has yet to fully unfold. IEA data showed that diesel and gasoline deliveries both accelerated between February and March, each rising by roughly 300,000 b/d. The increase suggests that consumers and businesses have been actively stockpiling fuel amid concerns over potential future supply disruptions.
The economic consequences are increasingly severe. Oxford Economics reportedly reduced its 2026 global GDP growth forecast to 2.4% from 3.0% following escalation of the crisis.
Market buffers
The crisis exposed limitations of the oil market’s traditional stabilizing mechanisms: spare production capacity, commercial inventories, and strategic petroleum reserves. The most important buffer—spare production capacity—proved far less effective than in past disruptions because much of it was located within the Gulf itself, where the supply shock originated.
Strategic Petroleum Rreserve (SPR) releases also struggled to offset the scale of the disruption. IEA member countries agreed to release 400 million bbl from emergency reserves, but projected Gulf production losses were expected to approach nearly twice that volume within only 2 months. The effectiveness of SPR releases was further constrained by structural mismatches in the market. Much of the lost supply consisted of medium sour crude, while many SPR inventories contain lighter grades more difficult for some refiners to substitute directly. Compounding the problem, the most acute shortages emerged in Asia rather than OECD countries, while elevated freight costs and shipping disruptions complicated arbitrage flows.
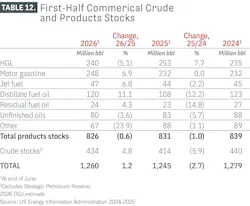
As oil-importing countries grapple with unprecedented disruptions to Middle Eastern supply, global petroleum inventories are being drawn down at a record pace. Since the outbreak of the conflict, observable global oil stocks have fallen by a cumulative 246 million bbl, including a 129 million-bbl draw in March followed by another 117 million-bbl decline in April, equivalent to about 3.9 million b/d. Excluding barrels stranded in Gulf storage facilities or trapped aboard tankers unable to transit the Strait of Hormuz, the effective inventory decline has been even steeper, with total global oil inventories estimated to have fallen by a cumulative 378 million bbl by April. The rapid depletion of buffer stocks highlights the growing risk of a sharp upward surge in oil prices if supply disruptions persist.
Refining
Global refining systems and refined product markets have come under severe pressure as crude supply disruptions, refinery attacks, and trade bottlenecks weigh on operations across multiple regions. Refinery throughput has been hit particularly hard in Asia-Pacific due to reduced crude arrivals, in the Middle East because of attacks on refining infrastructure and disrupted flows through the Strait of Hormuz, and in Russia amid increasingly effective drone strikes on energy infrastructure. Against this backdrop, global refinery crude runs in 2026 are now expected to average around 82 million b/d, nearly 1.6 million b/d below 2025 levels.
The impact proved particularly severe for Asian refiners, many of which rely heavily on Gulf medium sour crude as core feedstock. To compensate for lost Middle Eastern volumes, refiners across the region increasingly turned to more distant crude suppliers. Asian refiners faced multiple simultaneous pressures, including reduced availability of medium sour crude, sharply higher freight costs, operational inefficiencies associated with replacing feedstock using lighter grades, and reduced vacuum gasoil availability for middle distillate production.
Over the past decade, Gulf producers significantly expanded into refining and petrochemical investments, particularly across Asia. Consequently, disruptions in Gulf crude supply now reverberate throughout global refined product markets much more rapidly than during previous oil shocks.
Europe’s direct dependence on Gulf crude oil flows is far lower than Asia’s, but the region remains highly vulnerable to disruptions in refined product markets, particularly jet fuel. Around 75% of Europe’s jet fuel imports come from the Middle East Gulf, making the Strait of Hormuz disruption an immediate supply shock for European aviation. As Asian buyers competed for Atlantic Basin crude, European refiners faced higher feedstock costs and tighter supply availability. At the same time, Asian refineries that often serve as backup suppliers to Europe reduced exports to prioritize domestic markets. Rising freight costs and war-risk insurance premiums further increased delivered energy costs across the region. Meantime, many African economies remain especially vulnerable because of limited domestic refining capacity and heavy dependence on imported fuels.
In early May, refining margins stabilized, though they remained at historically high levels. As global markets gradually adapt to the loss of refined product exports from the Gulf region—and as importing nations begin to identify alternative supply sources—strong middle distillate crack spreads continue to support refining margins. However, refiners continue to face oil price volatility, uncertainty over crude supply availability, and rapid shifts in refined product trade flows and demand patterns.
Outlook scenarios
Looking ahead, the future trajectory of oil markets will depend heavily on how quickly Hormuz flows normalize and whether geopolitical tensions persist.
Under a likely scenario, partial normalization of transit occurs gradually over the coming months, although freight and insurance costs remain structurally elevated. Gulf production would slowly recover, but the geopolitical risk premium would persist.
More specifically, if an agreement is reached to end the conflict and oil flows through the Strait of Hormuz begin gradually recovering in third-quarter 2026, assuring the removal of all Iranian sea mines planted in the strait, global oil demand could return to growth by yearend.
However, oil supply is expected to recover more gradually than demand, likely leaving the global market in a sustained supply deficit for some time. According to IEA estimates, following the clearance of any mines, a minimum of 2-3 months will likely be required to re‑establish steady export operations, reflecting the need to exit oil‑laden tankers from the Gulf, reposition ballast tonnage, and rebuild port loading schedules. Upstream production and refining activity are also expected to recover even more slowly than shipping operations. Assuming flows through the strait gradually resume beginning in June, global oil supply is forecast to decline by 3.9 million b/d on average in 2026 to 102.2 million b/d, IEA noted.
With global inventories already declining at a record pace, oil prices are likely to remain highly volatile ahead of the peak summer demand season. Brent crude would likely stabilize within a $90–110/bbl range through late 2026 and early 2027.
Under a prolonged structural disruption scenario, if transit restrictions remain severe or infrastructure damage proves more extensive than expected, the market could enter a prolonged period of structural tightness. Freight rates would remain elevated, product shortages would intensify, strategic inventories would continue declining, and demand destruction would deepen. In such an environment, Brent crude could remain above $120/bbl for an extended period, while global recession risks would rise substantially.
Ultimately, the 2026 Strait of Hormuz crisis may prove to be more than a temporary supply shock. It represents a profound stress test for the modern global energy system and may mark the beginning of a new structural era for oil markets. Most importantly, the crisis shattered the long-standing assumption that the global oil system could always rely on uninterrupted Gulf exports. Even if production recovers and shipping flows normalize, governments, producers, refiners, and consumers are now operating in a fundamentally different energy security environment.
Notably, China entered the crisis in a stronger position than most major oil-consuming nations due to years of strategic stockpiling and supply diversification. In the 12 months before the Middle East war, China imported 11–13 million b/d of crude oil each month. Large crude inventories helped cushion the initial shock, while imports from Russia, Latin America, and West Africa reduced some dependence on Gulf supplies. However, the crisis exposed a key weakness in China’s energy security strategy. Despite diversification efforts, China still relies heavily on Middle Eastern medium sour crude, which remains central to its refining system. As a result, prolonged disruptions through the Strait of Hormuz continued to pose major risks.
Meanwhile, China restricted refined product exports to preserve domestic fuel supplies and limit inflationary pressures. While this supported its domestic market, it also tightened global diesel and jet fuel supplies, worsening shortages across Asia and other regions. A longer conflict would likely accelerate China’s efforts to expand strategic reserves, diversify supply sources further, increase overseas upstream investments, and develop alternative trade corridors.
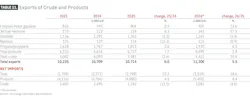
Compared with previous periods of oil crises, the US is now in a more advantageous position, as it has become a major oil producer and exporter. Rising global demand for alternative supply boosted exports of US crude, diesel, jet fuel, and LPG, while further reinforcing WTI’s growing importance in international pricing.
US oil markets
With Middle East production shut-ins reaching 10.5 million b/d in April and expected to peak near 10.8 million b/d in May, buyers in Asia and Europe have turned more aggressively to alternative suppliers, including the US.
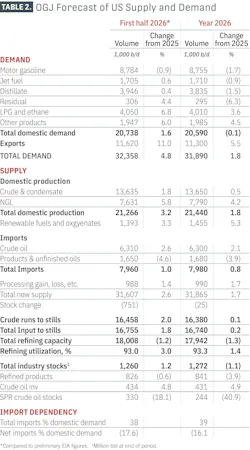
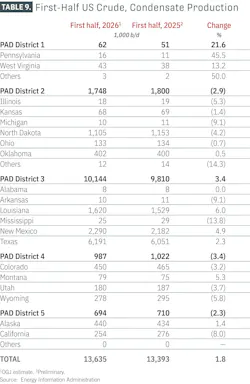
US crude production provides an important supply buffer, although not an immediate one. OGJ forecasts US crude oil production at 13.65 million b/d in 2026, up 0.5% from 2025, before rising to 14 million b/d in 2027. Higher prices support US shale production, but the response takes several months, limiting the ability of US producers to fully offset sudden global disruptions in the near term.
US shale producers have responded to the crisis more cautiously than during previous oil price rallies. Although higher Brent prices have improved drilling economics and strengthened cash flows, many publicly traded shale companies continue prioritizing shareholder returns, balance sheet discipline, and inventory preservation over rapid production growth. The experience of past boom-and-bust cycles has made producers more reluctant to aggressively expand drilling programs in response to what may prove to be a temporary geopolitical price spike.
In addition, the structure of the current disruption complicates investment decisions. While global crude prices surged following the Strait of Hormuz closure, producers also face uncertainty over how long the disruption will persist and whether additional OPEC supply could eventually return to the market. Service costs, labor constraints, and pressure from investors to maintain capital discipline have further limited the pace of expansion. As a result, US shale is acting more as a gradual stabilizing force rather than an immediate surge supplier, with production growth expected to materialize over quarters rather than weeks. The Permian basin remains the primary source of incremental US supply growth because of its lower breakeven costs and high associated gas production.
Trade flows are adjusting more quickly. According to Kpler data, US crude oil exports reached 5.15 million b/d in April, up 1.22 million b/d from March, as international buyers sought barrels outside the Middle East. The widening Brent-WTI spread strengthened the economics of US exports, making American crude more attractive to refiners abroad. With international demand still strong, US crude exports are likely to remain elevated, especially while Middle East flows remain constrained.
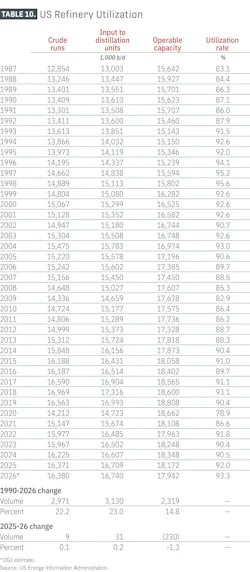
US refineries continue to run at high utilization rates as strong domestic and export demand supports margins. Crude runs are forecast to average about 16.4 million b/d in 2026, with refinery utilization around 93%. Gulf Coast refiners have benefited from stronger exports of diesel, jet fuel, and LPG, while West Coast crude processing has weakened following the February closure of Valero Energy’s 145,000 b/d Benicia refinery in California.
Gas, LNG markets
The global LNG market entered 2026 expecting a period of stabilization after several years of extreme volatility driven by the Russia-Ukraine war, energy insecurity, and tight global gas balances. New LNG export projects in North America and Africa were beginning to add supply to the market, helping soften prices across both Europe and Asia during the winter season. Buyers briefly gained confidence that the most severe phase of the global gas crisis had passed. That optimism, however, proved short-lived as disruptions to shipping through the Strait of Hormuz rapidly transformed the outlook for global gas markets.
The closure of the strait immediately removed a significant share of globally traded LNG supply from the market because Qatar and the UAE together account for a major portion of worldwide LNG exports. The disruption quickly exposed how vulnerable the modern LNG system remains to geopolitical shocks despite years of supply diversification efforts. Rather than creating a temporary regional disturbance, the strait disruption triggered a broad restructuring of global gas flows and pricing dynamics.
The crisis highlighted the increasingly interconnected nature of the LNG market. Europe and Asia now compete directly for flexible cargoes, meaning disruptions in one region rapidly spread across the global system. Once Gulf exports were interrupted, Asian buyers aggressively sought replacement cargoes from Atlantic Basin suppliers, particularly the US. Shipping costs surged as longer voyage distances reduced vessel availability and tightened freight markets.
Europe remains one of the clearest examples of how dramatically the global gas market has changed in recent years. Since the collapse of Russian pipeline gas deliveries, Europe has increasingly rebuilt its energy system around LNG imports. During the 2025-26 winter season, LNG accounted for more than 40% of Europe’s gas supply.
That growing dependence has also made Europe more exposed to global LNG competition. Prior to the Middle East disruption, relatively comfortable supply conditions and lower prices helped stabilize European gas markets. However, once Asian spot LNG prices moved above European benchmarks in March, cargoes rapidly shifted toward Asia. The episode underscored the fragility of Europe’s gas balance.
Asian markets faced even greater pressure because many countries remain heavily reliant on Gulf LNG supply. China, India, Pakistan, and Bangladesh all experienced immediate disruptions following the Strait of Hormuz closure. In response, several governments introduced emergency measures, including gas rationing, increased coal-fired generation, and accelerated nuclear restarts in an effort to preserve fuel supplies. These developments reinforced the reality that LNG demand in many developing economies remains highly price-sensitive.
Beyond the immediate market disruption, the crisis may also reshape the longer-term outlook for LNG supply growth. By May 2026, industry assessments continued to indicate that repairs to major portions of Qatar’s LNG infrastructure could require 3–5 years, particularly at Ras Laffan Industrial City where destruction of LNG Trains 4 and 6 removed roughly 12.8 million tpy of export capacity. Damage to Qatar’s infrastructure and delays to major expansion projects are expected to slow the arrival of the next major wave of LNG export capacity, increasing the possibility that structurally tight global gas markets may persist longer than previously expected.
Amid this uncertainty, the US has emerged as the single most important stabilizing force in global LNG markets. New export plants along the US Gulf Coast, particularly Plaquemines LNG and expansion trains at Corpus Christi, accounted for most of the world’s incremental LNG supply growth during the winter season. Without the rapid growth of US LNG exports, the disruption caused by the Strait of Hormuz would likely have produced a far more severe global energy shock. US LNG exports are forecast to average 17.0 bcfd in 2026 and 18.2 bcfd in 2027.
Global near-month LNG futures prices have remained elevated following the strait disruption, while price spreads between US and international gas markets remain wider than before the crisis due to near-maximum utilization rates at US LNG export plants.
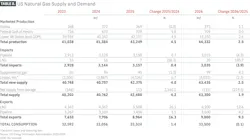
US natural gas production continues to support that growing export role. Marketed natural gas production in the Lower 48 averaged 117.2 bcfd during first-quarter 2026, a 4% increase from the same period in 2025. Production is expected to rise further to an average of 119 bcfd in 2026 and 124 bcfd in 2027, supported in part by higher crude oil prices that encourage associated gas production.
US LNG export capacity also continued expanding during 2026. In April, US LNG plant operators added about 0.9 bcfd of export capacity. Golden Pass LNG exported its first cargo from Train 1 on Apr. 22, adding around 0.7 bcfd of capacity and becoming the ninth operational LNG export plant in the US. Meanwhile, Cheniere began ramping up production at Train 5 of Corpus Christi Stage 3, adding another 0.2 bcfd of export capacity, while commissioning activities began for Train 6, which is expected to enter service during summer 2026. However, Exxon announced delays to startup activities for Golden Pass Trains 2 and 3.
About the Author

Conglin Xu
Managing Editor-Economics
Conglin Xu, Managing Editor-Economics, covers worldwide oil and gas market developments and macroeconomic factors, conducts analytical economic and financial research, generates estimates and forecasts, and compiles production and reserves statistics for Oil & Gas Journal. She joined OGJ in 2012 as Senior Economics Editor.
Xu holds a PhD in International Economics from the University of California at Santa Cruz. She was a Short-term Consultant at the World Bank and Summer Intern at the International Monetary Fund.

Laura Bell-Hammer
Statistics Editor
Laura Bell-Hammer is the Statistics Editor for Oil & Gas Journal, where she has led the publication’s global data coverage and analytical reporting for more than three decades. She previously served as OGJ’s Survey Editor and had contributed to Oil & Gas Financial Journal before publication ceased in 2017. Before joining OGJ, she developed her industry foundation at Vintage Petroleum in Tulsa. Laura is a graduate of Oklahoma State University with a Bachelor of Science in Business Administration.