Oil prices decline as Strait traffic resumes
Oil, fundamental analysis
May WTI futures moved substantially lower Friday on news that Iran was opening the Strait of Hormuz to all commercial traffic as a result of the announced cessation of Israel’s hostilities in Lebanon. Forecasts for war-related demand destruction also added pressure on prices. The first commercial crude inventory draw in 8 weeks, although small, had no impact on the price move lower nor did a collective drop in production coming out of OPEC.
Prices are now in a 9-day downtrend after peaking at $117.63/bbl on Apr. 7, 2026. WTI’s high was Monday’s $105.65/bbl while the Low was Friday’s $80.55, representing a 24% decline. Brent crude for June traded in a similar pattern with its high on Monday at $103.90/bbl and the low on Friday at $86.10. Both grades settled much lower than last week and the WTI/Brent spread is now $5.70. Prices are now where they were 5 weeks ago.
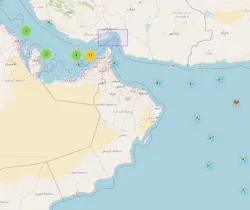
In Iran’s 10-point plan for ending the war was the condition that Israel cease bombing Lebanon or they would not open the Strait of Hormuz. The Trump administration imposed its own naval blockade of the area east of the Strait and was stopping ships that had been able to traverse the Strait due to arrangements with Iran or by paying its tolls. Ships sailing under the flag of China were ordered to return back west among others. It became nearly impossible to gauge the actual impact of both blockades with at least Tankermap.com indicating a handful of ships had made it through on the Oman side of the Gulf of Oman.
With the announced Israel/Lebanon ceasefire, Iran announced that the Strait of Hormuz is “completely open for the remaining period of the ceasefire." However, the IRGC has stated tankers must still “coordinate” with them. It’s not known if that includes paying tolls still. Indian refiners have now stop the purchase of Iranian crude as the 30-day US exemption from sanctions expires. Waivers for purchasing Russian oil have also expired and the US has stated it will not renew either of them. Iran has indicated that it has sufficient storage whereby it can withstand a halt in exports for up to 2 months.
OPEC saw a drop of 7.9 million b/d in output in March as a result of the Strait blockade. Meanwhile, China, still the world’s No. 1 crude importer, reached a new domestic oil production peak of 4.5 million b/d last month. China has been stockpiling crude reserves for several months.
The International Energy Agency (IEA) has warned that it will take the Middle East at least 2 years to recover and reach the pre-war production levels. The agency had previously cautioned that a prolonged war would impact both supply and demand with the latter seeing a dramatic drop due to higher prices. Currently, they are forecasting a drop in the global demand for crude of 90,000 b/d this year when, before the war, they projected a growth in demand of 730,000 b/d. Some countries have already taken demand reducing measures such as fuel rationing and shortened work weeks.
The Energy Information Administration (EIA)’s Weekly Petroleum Status Report indicated that commercial crude oil inventories for last week decreased while production remained flat. The SPR was down 4.9 million bbl to 409 million bbl as part of the pledged release.
The Producer Price Index (PPI) rose +0.5% last month to a year-on-year rate of +4.0%. Core PPI was +0.1-0.2%. This came on top of the prior week’s CPI which was +3.3%. Next up will be the PCE, the Fed’s preferred measure of inflation. The up-and-down situation with the US/Iran war has injected volatility into the US stock market. With the ceasefire and opening of the Strait of Hormuz and, the resulting lower oil prices the 3 main US indexes are positive week-over-week but the Dow still remains below the 50,000 mark hit in February. The USD is lower while gold is up but below its $5,000/oz mark.
Oil, technical analysis
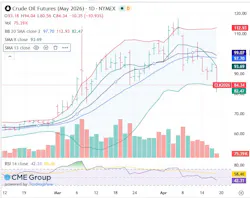
Friday’s move has the May 2026 WTI NYMEX futures are trading below the 8-, 13-, and 21-day Moving Averages with a Low that breached the Lower-Bollinger Band limit. Volume is down to 80,000 as May expires next week and traders turn their attention to June.
The Relative Strength Indicator (RSI), a momentum indicator, has fallen back into neutral territory at 42. Resistance is now pegged at $93.70 (8-day MA) while near-term Support is $82.45 (Bollinger Band). As has been the pattern for several weeks now, traders have to be cautious with their Friday positions as the market is closed until Sunday evening and the US/Iran talks continue on Saturday.
Looking ahead
Questions now remain in terms of the duration of the Israeli ceasefire with Lebanon which Iran has tied to the opening of the Strait of Hormuz. Should Israel violate the ceasefire, it would put Iran’s IRGC back in direct conflict with US naval forces in the area should the former attempt to close the Strait again. US/Iran negotiations are scheduled to continue this weekend in Islamabad.
Once again, markets will be closed until Sunday evening so the outcome of those talks will be key to market direction on the Open. Should peace hold, there will need to be a very detailed assessment of the long-term damage to all oil and gas infrastructure in the region. The tanker tracking map below indicates loaded oil vessels are exiting the Strait of Hormuz.
Natural gas, fundamental analysis
May NYMEX natural gas futures have now been on a 5-week downtrend on mild weather and a larger-than-expected storage injections despite healthy LNG export volumes. The week’s High was Monday’s $2.72/MMbtu while the Low was Tuesday’s $2.56, a tight range which indicates market direction uncertainty.
Natural gas demand this week has been estimated at about 95 bcfd while production was thought to be 106 bcfd. LNG exports are up +14% from year ago levels to 19 bcfd. In the UK, natural gas prices at the NBP were most recently down to $13.35/MMbtu. Dutch TTF futures were also lower at $13.45/MMbtu. Asia’s JKM was quoted at $19.20/MMbtu, only slightly down from the prior week.
The EIA’s Weekly Natural Gas Storage Report indicated an injection of 59 bcf vs. a forecast of +55 and a 5-year average of +24 bcf. Total gas in storage is now 1.970 tcf, 6.8% above last year and 5.8% above the 5-year average.
Natural gas, technical analysis
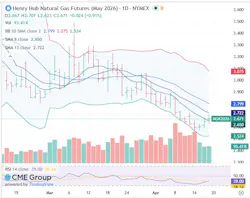
May 2026 NYMEX Henry Hub Natural Gas futures have remained below the 13- and 20-day Moving Averages, but just above the 8-day MA. Volume is below the recent average at 95,000. The RSI is now neutral at 35. Support is $2.65 (Thursday’s close) with key Resistance at $2.72 (13-day MA).
Looking ahead
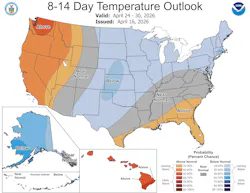
Global LNG prices are on the decline largely due to mild temperatures. With the Strait of Hormuz open now, markets will be monitoring Qatar’s ability to restart LNG exports. US storage levels are running above-normal and should remain that way given that April is typically a shoulder month. The 8-14-day forecast looks bearish for natural gas demand both space heating and power generation.
Opinion poll
About the Author

Tom Seng
Dr. Tom Seng is an Assistant Professor of Professional Practice in Energy at the Ralph Lowe Energy Institute, Neeley School of Business, Texas Christian University, in Fort Worth, Tex.