A week unlike any other for crude prices
Oil, fundamental analysis
The price of WTI settled last Friday at $90.90, which was already $14/bbl higher than the Friday before the US and Israel began their attacks on Iran. With the conflict continuing last weekend, Iran continued to pummel its neighboring petro-states and threatened any ships attempting to pass through the Strait of Hormuz. So, when the oil markets re-opened Sunday night, a lot of pent-up anxiety turned into the immediate buying of April NYMEX WTI futures with the Open price hitting $98/bbl leading to a session High of $119.50/bbl.
Trading Monday during regular business hours would moderate some ending in a closing price of $94.80/bbl but only after a wild day that saw a Low of $81.20 which created a daily Hi/Lo range of $32. The week’s Low was $76.75/bbl on Tuesday in what was seen at the time as numerous positive signs that the Strait of Hormuz would reopen. That didn't happen. Brent crude followed a similar pattern hitting a High of $119.50/bbl on Sunday evening and a Low of $81.15 on Tuesday. Both contracts settled higher week-on-week. The WTI/Brent spread fluctuated throughout the week but now sits at ($4.80). Neither the International Energy Agency (IEA)-announced reserve release nor a gain in US crude inventories could halt the on-going rally.
The Strait of Hormuz remains the key issue impacting global oil prices as conflicting reports exist throughout the media coverage. President Trump said the US Navy would escort ships, if needed while Energy Secretary Wright stated that the US Navy was too involved in the actual conflict with Iran to perform such duties. Secretary of Defense Hegseth stated Friday that the Strait of Hormuz was “open” for ships wishing to pass unless Iran fires upon them which the latter has explicitly threatened to do. The US Central Command has requested that more ships be sent to the region for an escort service but don’t want to engage directly with Iran’s naval forces and IRGC boats. Any deployment could take at least a month to arrive.
France has indicated a willingness to send its navy to assist tankers passage but there are no reports yet that those vessels have arrived on scene. Iran has attacked and damaged 3 ships so far while the US Navy destroyed Iranian mine-laying boats in the area.
The exact amount of oil and natural gas (LNG) stranded in the area of the Strait varies from source to source. There could be as little as 10 million b/d sitting idle up to as much as 20 million b/d. But the IEA and its member nations have pledged to release about 400 million bbl from its collective reserves. Member countries are obligated by policy to store an amount of oil equivalent to its import needs for a 90-day period. As one of the members, the US will release 170 million bbl in an “exchange” arrangement where buyers now will sell back to the US down-the-road to replenish the supplies.
While the market initially reacted favorably to the announcement, the logistics will need to be worked out and the exact daily amount that can be delivered needs to be clarified.
Furthermore, estimating the Strait of Hormuz oil interruption on the high end at 20 million b/d, the IEA release would only cover 20 days if the volumes can be delivered at that same level.
The IEA is estimating that, in addition to the flow of oil out of the Persian Gulf, there has been an interruption of 8.0 million b/d of production. India struck a deal with the US to temporarily waive the sanctions on purchasing Russia oil to alleviate its supply shortages. And both India and China have reached out to Iran requesting safe passage of shipments of oil each has purchased in the region.
The Energy Information Administration’s (EIA) Weekly Petroleum Status Report indicated that commercial crude oil inventories for last week increased while production remained at 13.7 million b/d.
The SPR held at 415 million bbl.
Inflation for February increased 2.4% in line with market expectations. Personal income for January rose 0.4%, lower than the forecasted +0.5% while spending was +0.4%, above the forecasted +0.3%. Housing starts jumped +7.2% in January while the PCE, the Fed’s preferred measure of inflation, came in at 0.4% and +3.1% year-on-year. Durable goods sales for January were flat while analysts sought a +1.3% rise. Fourth-quarter 2025 consumer spending, which reflects holiday activity, was +2.0% vs. an expected +2.4%. The higher energy prices with no end in sight have hammered global economic markets. All three US stock indices are down again this week. The USD has strengthened but has not been able to put a cap on the buying of crude. Gold is down but still holding about the $5,000/oz. mark.
Oil, technical analysis
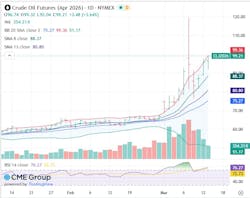
April 2026 WTI NYMEX futures remain above the 8-, 13, and 21-day Moving Averages but have fallen back beneath the Upper-Bollinger Band limit due to the vastly increased 20-day Average due to the recent higher daily Closing prices. Volume set a new record for this contract on Monday at 1.1 million contracts. Friday’s Volume was down to 360,000. The Relative Strength Indicator (RSI), a momentum indicator, is in significantly overbought territory at 76. Resistance is now pegged at $99.90 (Upper-Bollinger Band) while near-term Support is $95.85, Thursday’s Settle. The 'Friday Effect' is also in place as traders have to worry about events over the weekend that could further increase prices while the market is closed until Sunday evening.
Looking ahead
Market observations remain the same as those for this past week.
- The Strait of Hormuz. Is it truly open and are oil and LNG tankers safely passing? If not, what actions are being taken to accomplish this?
- Will the conflict settle-down at all? Will there be some initial talks that will lead to a temporary ceasefire? The opening of the Strait of Hormuz would have to be the primary consideration before any negotiations begin.
- If there is a halt to the war, regional damage assessments will have to be conducted to determine any long-term impact on supply.
- Will the release of the 400 million bbl announced by the IEA have material impact on the daily global supply of oil and are there enough reserves if this war is prolonged?
Natural gas, fundamental analysis
April NYMEX natural gas futures rose on Monday somewhat in tandem with the broader crude market but could not benefit from higher global LNG prices given the limitation on current US LNG exports. Mild forecasts and a small storage withdrawal kept prices in a short range. The week’s High was Monday’s $3.50/MMbtu while the Low was Tuesday’s $2.95. Natural gas demand this week has been estimated at 112 bcfd while production was thought to be 112 bcfd. LNG exports held at 18.0 bcf. In the UK, natural gas prices at the NBP were most recently $17.15/MMbtu while Dutch TTF futures were $17.05. Asia’s JKM was quoted at $16.20/MMbtu. The EIA’s Weekly Natural Gas Storage Report indicated a withdrawal of 38 bcf vs. a forecast of -46 and a 5-year average of -64 bcf. Total gas in storage is now 1.848 tcf, now 8.3% above last year and 0.9% below the 5-year average.
Natural gas, technical analysis
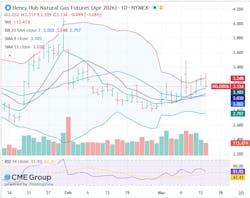
April 2026 NYMEX Henry Hub Natural Gas futures have risen to above the 8-, 13-, and 20-day Moving Averages while piercing the Upper-Bollinger Band Limit. Volume is below the recent average at 115k. The RSI is now neutral at 52. Support is $3.10 (8-day MA) with key Resistance at $3.35.
Looking ahead
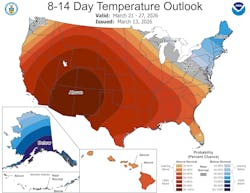
The EU is considering subsidies or a price cap for surging natural gas prices. Spring temperatures appear to be coming-in early while domestic natural gas prices can’t benefit from the higher global LNG prices. However, April is the first month of reinjections into storage for next winter which should keep a floor on prices until summer A/C demand for power kicks in.
About the Author

Tom Seng
Dr. Tom Seng is an Assistant Professor of Professional Practice in Energy at the Ralph Lowe Energy Institute, Neeley School of Business, Texas Christian University, in Fort Worth, Tex.