Oil, fundamental analysis
Crude prices fell to levels not seen in 3 months during this holiday-shortened trade week as any bullish support fell sway to several bearish signs.
WTI’s high for the week was Tuesday’s $66.05/bbl as the market believed, erroneously, that the new sanctions on India would reduce its oil purchases from Russia. Additionally, Ukraine continued its attacks on Russian oil infrastructure raising concerns about diminishing output. However, affirmation from India regarding continuing Urals purchasing, the OPEC+ group meeting this weekend and, an unexpected increase in crude inventories sent prices lower.
WTI was as low as $61.5/bbl on Friday, below the technically significant Lower-Bollinger Band limit at $61.88. Brent crude also hit its high on Tuesday at $69.55/bbl and its low on Friday at $65.05/bbl. Both grades are substantially below last week’s levels while the WTI/Brent spread has widened to ($4.05).
India’s Finance Minister this week emphasized his country's plan to continue to purchase Russian oil despite the recently added 25% tariffs imposed by the Trump administration. In turn, Russia has lowered its sales price to India to help offset some of that lost revenue.
Meanwhile, even though Russian output has largely not declined, lower prices and added global production is causing financial hardship for the country’s oil giants. Rosneft, Russia’s largest oil produced saw a 68% decline in profits during first-half 2025.
OPEC+ meets this weekend and market observers are on both sides of the tables in terms of what action, if any, the group may take. Some believe that the current low prices will act as a disincentive to increasing output while others contend that the goal of the group is to take back market share at any cost. What has yet to be quantified is whether or not all of the members are meeting the latest output increases. Historically, they have not risen to the stated levels.
The Energy Information Administration’s (EIA) Weekly Petroleum Status Report indicated that commercial crude oil inventories for last week increased while production remained stable at 13.4 million b/d. The EIA is reporting that the average daily crude production for June hit a new high of 13.58 million b/d.
US job growth continued to stall in August as only 22,000 jobs were added vs. an expected increase of 75,000. Furthermore, June’s numbers were revised to a net loss of 13,000 jobs.
New claims for unemployment benefits last week rose to the highest level since June at +237k up from the prior week’s +229k. Positive news came from the ISM which reported that their New Orders Index for August was 56.0 vs. July’s 50.3 and the Services PMI was 52.0 last month vs. July’s 50.1. The Dow and S&P indexes are lower week-on-week on the meager jobs report while the NASDAQ is slightly higher. The USD is flat on the week which is neither supportive nor negative for crude.
Oil, technical analysis
October 2025 WTI NYMEX futures prices have fallen below the 8-, 13- and 20-day Moving Averages and have approached the Lower-Bollinger Band limit, a Buy signal. Volume is around the recent average at 260,000.
The Relative Strength Indicator (RSI), a momentum indicator, is in neutral territory at 43 but declining. Resistance is now pegged at $63.66 (8-day MA) while near-term critical Support is $61.28 (Lower-Bollinger Band).
Looking ahead
We have India’s response to the additional Trump tariffs and now know the country will continue to by Russian oil, removing that bullish sentiment from the market. We will now this weekend what tack OPEC+ takes in terms of output.
Trading won’t start again until Sunday evening at 6 pm EDT. The Federal Reserve will now have to weigh the weaker employment environment in its determination of any rate decrease this month.
The National Hurricane Center is watching Invest 91L which is expected to grow to TS Gabriel within days. Its current path takes it across the Lesser Antilles by late next week. With Labor Day Weekend behind us, gasoline and aviation fuel demand will decline which may hurt the prospects of higher oil prices.
Natural gas, fundamental analysis
October NYMEX natural gas futures prices managed to continue their climb higher this week despite the absence of widespread heat and a storage injection that was near expectations. However, October does technically represent the last month to inject gas ahead of the November-March winter period and the $3.00/MMbtu level was breached.
The week’s High was $3.15 /MMbtu on Friday with the week’s Low of $2.87 on Tuesday. Supply last week was -0.7 bcfd to 111.9 bcfd vs. 112.6 the prior week. Demand was -3.1 bcfd to 99.6 bcfd vs. 102.7 bcfd the week prior, with the biggest decrease in the power sector.
Exports to Mexico were 7.3 bcfd vs. 7.5 the prior week. LNG exports were 16.1 bcfd vs. 16.4 bcfd the prior week. Dutch TTF prices have risen slightly to $9.45/MMbtu equivalent while Asia’s JKM was quoted at $11.30/MMbtu.
The EIA’s Weekly Natural Gas Storage Report indicated an injection of 55 bcf, below the forecasted +28 bcf and the 5-year average of +38 bcf. Total gas in storage is now 3.272 tcf, dipping to 2.2% below last year and to 5.6% above the 5-year average. Theoretically, there are just 7 weeks left in the injection season. To achieve a season-ending volume of 3.9 tcf, injections would have to average +90 bcf/week to hit 3.9 tcf and +104 bcf to reach 4.0 tcf.
Natural gas, technical analysis
October 2025 NYMEX Henry Hub Natural Gas futures are above the 8-, 13- & 20-day Moving Averages and touching on the Upper-Bollinger Band Limit, a Sell signal. Volume was 120k and lower than the recent average. The RSI is neutral at 49. Support is pegged at $3.00 with critical Resistance at $3.15 (Upper-Bollinger Band) as the next key area if prices are to continue higher.
Looking ahead
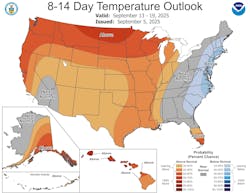
The NOAA 8-14 day forecast indicates a large area of the country will experience below-normal temperatures for much of the Eastern Seaboard with areas of above-normal west of that region. The Tropics bear watching for natural gas as well. The “storage spread” for natural gas still exists as October is trading around $3.05/MMbtu while December is $3.85 and January is $4.18. Those will remaining capacity may take advantage of this spread which will provide price support even with cooler temperatures.
About the Author

Tom Seng
Dr. Tom Seng is an Assistant Professor of Professional Practice in Energy at the Ralph Lowe Energy Institute, Neeley School of Business, Texas Christian University, in Fort Worth, Tex.


