Modified test method measures wax deposition qualities of opaque crude
Vivian Yuen Gordon Chiu
Phase Technology Inc.
Richmond, BC
Development of a new automated test method to measure the wax appearance temperature (WAT) of opaque crude oils with 1.0° C. precision used a modified version of American Society of Testing and Materials (ASTM) D5773, the standardized cloud-point (CP) test method designed for transparent petroleum liquids.
The new method allows the relative amount of wax formation and dissolution for different opaque crudes to be compared as a function of temperature using a technique involving the direct detection of light scattered by wax crystals. It can also determine wax disappearance temperature (WDT).
Compared with previous manual testing methods, the modified test method, with its shorter testing times, real-time test results, and elimination of subjectivity in reported results, can provide refiners and pipeline operators more timely and accurate operational data to prevent potentially costly wax deposition problems.
WAT, WDT
As defined by ASTM D2500-IP219, D3117, or D5773-IP446, WAT, or CP, is the temperature at which haziness caused by formation of small wax crystals is first observed in a sample of crude or refined oil under prescribed cooling conditions.1 2 3 4 5
WDT, similarly, is the temperature at which these wax crystals redissolve into liquid form under specified warming conditions.
Because WAT and WDT help predict the wax deposition characteristics of crude oils, they are useful across the petroleum industry as starting metrics in evaluating wax formation, as crudes produced from even the same region often demonstrate disparate rates of wax deposition and dissolution.
In addition to a cold-flow parameter, WAT is also an indicator of potential crude incompatibility, a monitor of evolving crude quality, and a validation point in tuning wax-phase boundary and deposition modeling.6
WAT often is also an important flow-assurance parameter, along with other fluid characterization and rheological data, in the design and development of subsea and land pipeline systems and wax remediation options.7 8
Earlier test methods
While a variety of test methods have been used to measure WAT, many involve processes that have proved to be imprecise, time-consuming, and highly subjective, often yielding results with high margins of error.
Cross-polarization microscopy (CPM) is generally accepted to be the most sensitive visual method for measuring CP, or WAT. Though a direct measurement method capable of yielding more reliable results than inferred measurement methods used to determine WAT, CPM is time-consuming and requires experienced human interpretation, making it less-than-practical as a daily analytical tool for WAT measurement.
Other common visual methods are ASTM D2500, a manual method, and D5773, an automatic light-scattering method. These methods, however, are limited to transparent fuels.
Other techniques such as differential scanning calorimetry (DSC), nuclear magnetic resonance (NMR), viscometry, and Fourier Transform Infrared Spectroscopy (FT-IR) are indirect and typically less sensitive than visual methods.9 10 11 12
New test method
In contrast to the manual, subjective, and often less precise processes previously used for WAT measurement, a new automated method based on ASTM D5773 uses an optical scattering technique with enhanced optical configuration and reduced sample thickness to penetrate through visually opaque crude samples.
A thin layer (< 1 mm) of crude is sandwiched between a transparent flat cover and a metal surface that is continuously heated or cooled by a thermoelectric cooler. A resistance-temperature device (RTD) measures the sample's temperature.
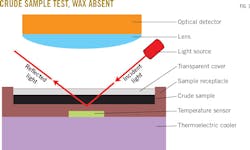
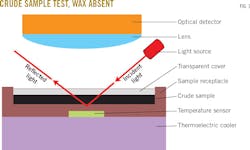
When there is no wax present in the crude sample, incident light at an oblique angle penetrates the transparent cover and the sample and is specularly reflected in the opposite direction.
The minimal amount of light detected by an overhead optical detector represents the baseline signal of the device.
Fig. 1 shows a diagram of the test method using a crude sample that does not contain wax.
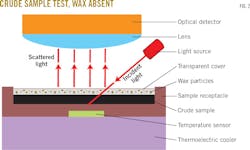
When waxes are present in the crude sample, scattered light emerges from the slide and is focused through the lens to the optical detector. WAT, then, is the temperature at which the light signal monitored by the optical detector starts to increase from the baseline, while WDT is the temperature at which the light signal returns to the baseline.
Fig. 2 shows a diagram of the test method using a crude sample containing waxes.
Testing, results
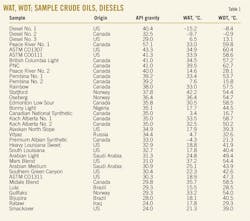
A series of 35 opaque crude oil and diesel samples from around the world were tested to validate the new WAT-WDT test method (see table).
The new test method can determine both WAT and WDT automatically in less than 1 hr, as well as provide results that show comparative information on tested crudes' rates of wax deposition and melting.
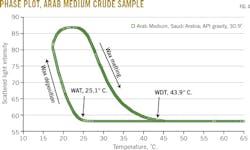
Fig. 3 shows the new method's determination of WAT and WDT using a crude sample from the Middle East.
The plot shows the thermal trajectory of a Saudi Arabian crude starting at 65° C., at which point it is completely liquid with no wax (low scattered optical signal). The sample was cooled and its optical signal continuously monitored.
The signal, which under the new test begins to rise as wax starts to form, determined the sample's WAT to be 25.1° C.
Cooling the sample further to incur more waxes before warming it and allowing it to melt completely, measured WDT. WDT is the temperature at which the optical signal returns to the baseline, in this case 43.9° C.
Fig. 3 also provides information on the rate of optical signal rise during cooling and the rate of decrease during warming as they relate to the rate of wax deposition and melting, respectively.
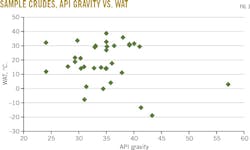
Based on the results of all crude and diesel samples tested (see table), the new test method also showed no apparent correlation between WAT and API gravity (Fig. 4).
The new method can also reveal additional information about correlations or noncorrelations between characteristics of different petroleum liquid samples tested.
Samples of different opacity
The new test method enables distinct detection of samples' WAT and WDT regardless of each sample's opaqueness.
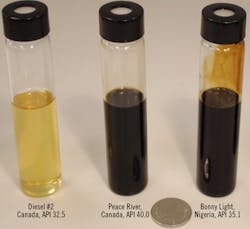
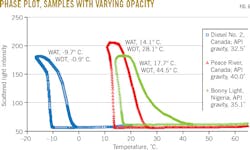
Testing used three samples of petroleum liquids with varying optical opacities (Fig. 5): Diesel No. 2 and Peace River crude, from Canada, and Nigerian Bonny Light crude. While the diesel is transparent and the crudes opaque, each of their WATs and WDTs were uniquely detectable.
Fig. 6 shows phase plots for the three samples as well as a slower rate of wax dissolution for Bonny Light compared with Peace River.
Similar API gravity
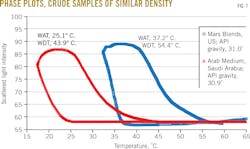
The new method also revealed that crudes with similar API gravities do not necessarily possess comparable WAT or WDT, which could be due to varied carbon profiles and blending.
Fig. 7 shows phase plots for Mars Blend (US) and Arab Medium (Saudi Arabia), which have similar API gravities near 31°.
The new test method, however, indicated a WAT of 37° C. for Mars Blend and 25° C. for Arab Medium, suggesting that routine metrics such as API gravity or viscosity are not predictive of wax formation characteristics.
Same region
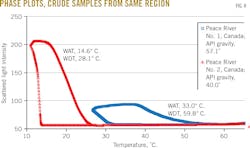
Test results of crude samples from the same region using the new method revealed quite different wax deposition patterns despite the proximity of their production.
WATs of Peace River No. 1 and 2 crudes sourced from nearby production areas in Canada differed by more than 18° C. Test results also showed disparate rates of wax deposition and dissolution.
These differences underline the importance of regular monitoring of crude properties due to changes of location, extraction depth, evolution of time, or even methods of production and blending.
Fig. 8 shows phase plots for Peace River No. 1 and 2 crude samples.
Similar WAT
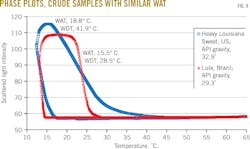
Heavy Louisiana Sweet (HLS) and Brazilian Lula crude display similar WATs and wax formation rates. Test results, however, showed HLS had a more extended rate of wax dissolution, its WDT measuring more than 13° C. warmer than the Brazilian crude.
These quality differences likely would suggest alternative storage and transportation for the sampled crudes in terms of remain-on-board status, as well as for sludging in tank bottoms, fouling, and interferences with other measurements.
Fig. 9 shows phase plots for HLS and Lula.
Similar WAT, WDT
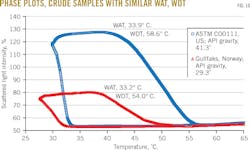
Validation tests of the new method also used crudes of similar WAT and WDT: a US crude and Norwegian Gullfaks. Results showed that the relative rates of wax deposition and melting still could differ sharply for crudes with comparable WAT and WDT.
Fig. 10 shows phase plots for these crudes, with the US sample demonstrating a steeper rise in signal at successive temperatures below WAT, implying it is more prone than Gullfaks to wax formation.
This tendency, alongside other data (pour point, viscosity, gelling strength, etc.) could form the basis of wax mitigation regimes to safeguard crude production, transportation, storage, and refining equipment.
References
1. "ASTM D2500-11, Standard Test Method for Cloud Point of Petroleum Products," ASTM International, West Conshohocken, Pa., 2011.
2. "IP 219: Petroleum products - Determination of cloud point," Energy Institute, London, 2013.
3. "ASTM D3117-03, Standard Test Method for Wax Appearance Point of Distillate Fuels (Withdrawn 2010)," ASTM International, West Conshohocken, Pa., 2003.
4. "ASTM D5773-15, Standard Test Method for Cloud Point of Petroleum Products (Constant Cooling Rate Method)," ASTM International, West Conshohocken, Pa., 2015.
5. "IP 446: Determination of the cloud point of petroleum products - Automatic constant cooling rate method," Energy Institute, London, 2009.
6. Gonzalez, D.L., Jamaluddin, A.K.M., Solbakken, T., Hirasaki, G.J., and Chapman, W.G., "Impact of Flow Assurance in the Development of a Deepwater Prospect," SPE 110833, SPE Annual Technical Conference and Exhibition, Anaheim, Calif., Nov. 11-14, 2007.
7. Golczynski, T.S. and Kempton, E.C., "Understanding Wax Problems Leads to Deepwater Flow Assurance Solutions," World Oil, Vol. 227, No. 3, March 2006, pp. D7-D10.
8. Suppiah, S., Ahmad, A., Alderson, C., Akbarzadeh, K., Gao, J., Shorthouse, J., Khan, I.A., Forde, C., and Jamaluddin, A., "Waxy-Crude Production Management in a Deepwater Subsea Environment," Oil and Gas Facilities, Vol. 1, No. 1, February 2012, pp. 53-64.
9. Coutinho, J.A.P., and Daridon, J., "The Limitations of the Cloud Point Measurement Techniques and the Influence of the Oil Composition on Its Detection," Petroleum Science and Technology, Vol. 23, No. 9-10, September 2005, pp. 1113-1128.
10. Dantas Neto, A. A., Gomes, E. A. S., Barros Neto, E. L., Dantas, T. N. C., and Moura, C. P. A. M., "Determination of Wax Appearance Temperature (WAT) in Paraffin/Solvent Systems by Photoelectric Signal and Viscosimetry," Brazilian Journal of Petroleum and Gas, Vol. 3, No. 4, 2009, pp. 149-157.
11. Hammami, A., Ratulowski, J., and Coutinho, J.A.P., "Cloud Points: Can We Measure or Model Them?" Petroleum Science and Technology, Vol. 21, No. 3, January 2003, pp. 345-358.
12. Karan, K., Ratulowski, J., and German, P., "Measurement of Waxy Crude Properties Using Novel Laboratory Techniques," SPE 62945, SPE Annual Technical Conference and Exhibition, Dallas, Oct. 1-4, 2000.
The authors
Vivian Yuen ([email protected]) is a senior engineer in the research and development group at Phase Technology, Richmond, BC. She is responsible for research related to cold-flow properties and phase behavior of hydrocarbons, specializing in crude oil wax behavior. Yuen holds BS (2002) and MS (2004) degrees in chemical and biological engineering from the University of British Columbia, Vancouver.
Gordon Chiu is chief operating officer of Phase Technology Inc., specializing in the design and manufacture of analytical instruments to measure cold-flow properties of petroleum oils and fuels. Active in various international standards organizations, Chiu serves as a technical contact to ASTM Committee D02 on petroleum products. He holds an MS in engineering (1988) from the University of British Columbia, Vancouver, and a PhD in plasma physics (1994) from Princeton University, New Jersey.
