Earnings soar as OGJ200 list shrivels to 146 firms
As strong worldwide energy demand and geopolitical tensions drove the petroleum market last year, the industry continued to see consolidation in the US.
For a variety of reasons, the OGJ200 list now contains 146 companies. This is down from last year's already slim list of 154, but the current group by far outperformed the previous one in terms of financial results.
This annual special report tracks publicly traded, US-based companies with reserves as well as production of oil and gas in the US. The OGJ200 ranks these firms by assets.
Click here to view the OGJ200 in PDF.
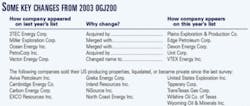
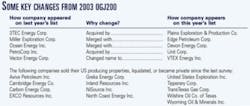
Four of the firms that appeared in the compilation last year were the targets of mergers and acquisitions, while 13 others no longer appear on the list because they sold their US producing properties, liquidated, or became private companies since last year's OGJ200 report (OGJ, Sept. 15, 2003, p. 44) and therefore are not eligible for the compilation.
There are four companies—El Paso Corp., Empiric Energy Inc., VTEX Energy Inc., and Vineyard Oil & Gas Co.—that had not filed their annual results with the US Securities and Exchange Commission in time to have their performance considered and ranked in this report. They are included in the count of 146 firms, but none of their results are included in the rankings.
Nine companies in the report were not on the list last year. Clearly, any comparison of one year's OGJ200 with another year's compilation will be skewed because of the different mix of firms each contains.
This annual compilation began as the OGJ400, when the list was limited to 400 companies; then in 1991, fewer publicly traded companies resulted in the OGJ300. In 1996, the list shrank further and became the OGJ200. Each year since, the list has continued to contract.
Market forces, drilling
Tight inventories of oil and refined products and the war in Iraq kept oil prices elevated throughout 2003. High crude prices held refining margins in check, although pump prices for gasoline were strong.
The average price of US wellhead crude oil increased to $27.56/bbl last year, compared with $22.51/bbl in 2002, while the average landed cost of imported crude oil increased to $27.69/bbl from $23.91/bbl. The composite refiner acquisition cost of crude oil moved up to an average $28.50/bbl last year from $24.10/bbl the prior year.
The average pump price of all grades of gasoline last year averaged $1.64/gal vs. $1.44/gal in 2002, according to the US Department of Energy's Energy Information Administration. Heating oil prices gained last year, as well.
US Gulf Coast cash refining margins averaged $3.25/bbl last year, according to Muse, Stancil & Co. The highest monthly average for the margin last year was February's, at $5.83/bbl. For 2002, the US Gulf Coast cash refining margin averaged $2.02/bbl.
The Baker Hughes Inc. international count of active rotary rigs showed an increase last year, to 2,174 from a count of 1,829 the year before, and nearly the entire jump can be attributed to increased activity in the US.
The average US rig count surged 201 rigs to 1,032 last year. The number of rigs operating in the Gulf of Mexico declined to 104 from an average of 109 in 2002 and a recent high of 148 in 2001.
Total US exploratory and development well completions numbered 33,847, up from 28,044 in 2002, according to the latest estimates from the American Petroleum Institute. Of the total completions last year, 62% were gas wells, 12% were dry holes, and the rest were oil wells. API estimates that in 2001 there were 36,061 exploratory and development well completions in the US.
Production, reserves
This year's group of OGJ200 companies drilled 12,398 net wells during 2003, an 11% increase from the number drilled by last year's OGJ200 group.
The current group's capital and exploration expenditures surpassed last year's by 8% at $55.8 billion.
The operating results of the group mostly reflect such heightened activity levels.
The survey reveals an increase in most categories of production and reserves that are included in the report.
This report breaks out production and reserves into what the company holds worldwide as well as those quantities located in the US only.
The group's worldwide liquids production increased 2.4% compared with the group in the previous OGJ200 report, which contained fewer firms. US liquids production, which includes crude oil, condensate, and natural gas liquids, declined 4% in 2003 from the prior year, however. The increases in worldwide and US liquids reserves for the group were negligible, each growing less than 1%.
The group's worldwide natural gas production increased just 0.9%, but its gas production in the US moved up 1.9%. Gas reserves for the group declined in the US as well as worldwide. The OGJ200 companies' US gas reserves were 2% lower, but worldwide, the group's gas reserves were only 0.8% lower than in last year's report.
Group financial results
The group's financial performance last year was solid. Only 24% of the firms posted a net loss for the year, and only one of those companies had a loss greater than $100 million.
Of the 154 companies in last year's OGJ200, 39% posted a loss for 2002 operations, and four of those losses were in excess of $100 million. On the other hand, there are 27 companies in this year's group that posted 2004 earnings of more than $100 million. This compares with 19 such firms in last year's OGJ200.
Collectively, the OGJ200 group recorded 2004 net income of $48.7 billion. This is up 167% from the 2002 results of the previous group. Revenues for 2003 were $603.5 billion, a 31% increase.
Yearend assets for the group climbed 14%, while stockholder equity gained 24%.
Four firms posted negative stockholder equity at the end of last year, as their liabilities exceeded their assets.
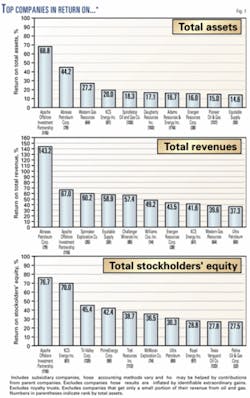
The group's return on stockholder equity for 2003 was 20%, up 10 percentage points from a year earlier. Meanwhile, their return on assets was 9%, and return on revenue was 8%. These are all much improved from the previous year's results.
Changes from previous list
Other than there being a loss of some companies and the addition of a few, there are not many changes in the types of companies that the OGJ200 comprises.
Again there are three publicly traded limited partnerships in the group, the largest still being Energy Partners Ltd. with $544 million in assets. Apache Offshore Investment Partners remains the smallest of the three, with total yearend assets of $11.7 million. The smallest firm in the entire group as ranked by assets is Petrol Industries Inc., which has been so for the past 4 years.
And the top-ranked company remains ExxonMobil Corp., with yearend 2003 assets of $174 billion.
Combined assets of the top 10 companies account for 81% of assets of the entire OGJ200 group, up from 79% last year.
Top 20 companies
Eighteen of the top 20 firms as ranked by assets were also among this subgroup in the previous OGJ200. El Paso Corp. and Ocean Energy Inc. disappeared from the top 20 and were replaced by Chesapeake Energy Corp. and XTO Energy Inc.
El Paso Corp., whose results were not available due to a delay in the release of its 10K report to the SEC, would be in the top 20 and would rank in many of the other top 20 lists in this report, as it did last year.
Ocean Energy, which previously ranked No. 16, merged into Devon Energy Corp. in April 2003. Following this transaction, Devon Energy now ranks at No. 4, up three places from a year ago.
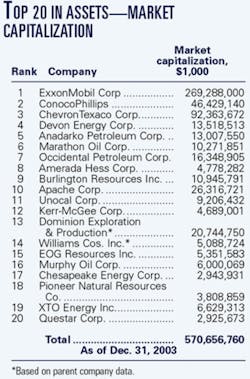
ConocoPhillips is now the second-ranked company, with $82 billion in assets, having traded spots with Chevron TexacoCorp., currently ranked third with $81 billion in assets at the end of 2003.
Ranked fifth is Anadarko Petroleum Corp., with $20.5 billion in assets. Next on the list are Marathon Oil Corp., Occidental Petroleum Corp., Amerada Hess Corp., and Burlington Resources Inc.
The tenth-ranked firm is Apache Corp., which last year was No. 12. Apache's yearend 2003 assets totaled $12.4 billion. Unocal Corp. moved to No. 11 from ninth place last year, and Kerr-McGee Corp. fell one notch to No. 12.
Next on the list is Dominion Exploration & Production Inc., followed by Williams Cos. Inc., EOG Resources Inc., and Murphy Oil Corp. Chesapeake Energy is No. 17, up from No. 21 a year ago, and Pioneer Natural Resources Co. is No. 18.
XTO Energy moved up to No. 19 from No. 23 last year, and the twentieth-ranked company is Questar Corp., unchanged from a year ago.
Top 20 firms' results
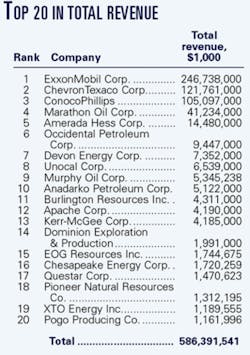
The financial results of the top 20 firms drive those of the entire group, as these few companies' 2003 net income accounted for 94% of the group's profits and 97% of their revenue.
Compared with the top 20 in last year's OGJ200, net income of this year's largest 20 was up 172%, and revenue was 32% higher.
Worldwide capital and exploration outlays of the top 20 totaled $47 billion during 2003, up 6% from the previous report.
The top 20 companies accounted for 7,757 net wells drilled in the US during 2003, accounting for 63% of those drilled by the whole OGJ200 group of firms.
While the US gas reserves of the OGJ200 declined, those reserves for the top 20 firms grew 4.4%. The top 20 firms' worldwide gas reserves increased 2.6%, also contrary to the change for the entire group.
The market capitalization of the top 20 companies as of Dec. 31, 2003, was $571 billion. This compares with yearend 2002 market cap of the previous top 20 group of $518 billion.
OGJ also ranked the companies that recorded the highest levels of capital and exploratory spending during 2003. Included on this top 20 list are Forest Oil Corp., Newfield Exploration Co., and Noble Energy Inc. These top 20 firms combined for capital expenditures of $48 billion, down from the previous list's $50 billion of spending during 2002.
However, for the top 20 as ranked by the number of US net wells drilled, the number of wells increased to 8,676 from 8,269 a year earlier. Among the firms appearing on this top 20 list are Equitable Supply Co., Patina Oil & Gas Corp., and Fidelity Exploration & Production Co., Range Resources Corp., and Energen Resources Corp.
Fastest growers
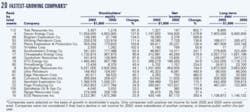
The OGJ200 list of fastest-growing companies ranks firms based on growth in stockholder equity. For a company to appear on the list, it must have recorded positive net income in both 2003 and 2002, and it must have increased its net income last year. Excluded from this list are limited partnerships, newly public companies, and subsidiaries. This list is limited to the top 20 fastest growers.
Trek Resources Inc. is the fastest grower in this year's OGJ200. Ranked No. 112 by assets, Trek Resource's stockholder equity increased nearly threefold last year. Additionally, the company's net income for 2003 was up 803% from 2002.
Devon Energy was second on the list, increasing its stockholder equity 138%. Devon Energy's 2003 net income grew to $1.6 billion, up from 2002 profits of $104 million.
Following Devon Energy on the list of fast growers are Brigham Exploration Co. and Whiting Petroleum Corp. The fifth fastest-growing company in this report is Plains Exploration & Production, followed by Tri-Valley Corp. These six companies posted yearend stockholder equity at the end of 2003 that was more than double that of yearend 2002.
Southwestern Energy Co. is the seventh-fastest grower, followed by Chesapeake Energy, Quicksilver Resources Inc., and XTO Energy.
A year ago, only 10 companies qualified to appear on the list of fastest-growing firms. The only companies to appear on this year's list of fastest-growing companies and last year's are Devon Energy and Pogo Producing Co. Devon Energy was the third-fastest grower for 2002. Pogo was the fourth-fastest grower then but now is ranked at No. 17 on this dynamic list.
CORRECTION Equitable Supply's gas reserves in the OGJ200 report (OGJ, Sept. 13, 2004, p. 28) should have been 2,064 bcf. This would rank Equitable at No. 13 for gas reserves in the US and No. 19 for worldwide gas reserves.
