OGJ150 reported smaller losses in 2016; revenues, spending down
The OGJ150 group of US oil and gas producers collectively posted 2016 full-year net losses of $47.66 billion on revenues of $477.6 billion compared with net losses of $141 billion in 2015 on revenues of $584.5 billion.
Amid the lowest commodity prices in a decade, this decrease in net losses was attributable to gains on asset sales, lower operating and exploration expenses, and higher impairment charges recognized in 2015 for oil and gas producing properties.
The group continued to reduce capital and exploration expenditures in 2016, which were down 46% from a year earlier.
To qualify for the OGJ150, oil and gas producers must be US headquartered, publicly traded, and hold oil or gas reserves in the US. Companies appear on the list ranked by total assets but are also ranked by revenues, stockholders' equity, capital expenditures, earnings, production, reserves, and US net wells drilled.
As always, data for this year's list reflect the prior year's operations.
Market overview
The annual average spot price of North Sea Brent crude oil was $43.73/bbl in 2016, representing a decrease of 16.5% compared with 2015. The annual average spot price of West Texas Intermediate crude oil was $43.34/bbl, down 11% compared with a year earlier. Average New York Mercantile Exchange natural gas prices declined 3% to $2.54/MMbtu in 2016 from $2.63/MMbtu in 2015.
According to Muse, Stancil & Co., refining cash margins in 2016 averaged $11.14/bbl for US Midwest refiners, $14.18/bbl for West Coast refiners, $9.25/bbl for Gulf Coast refiners, and $3.73/bbl for East Coast refiners. In 2015, these refining margins were $17.58/bbl, $22.42/bbl, $11.27/bbl, and $5.52/bbl, respectively.
US crude oil production of 8.87 million b/d for 2016 was down from 9.42 million b/d a year ago, according to EIA data. EIA estimates that dry gas production averaged 72.4 bcfd in 2016, a decline of 2.2% from 2015 and the first decline since 2005.
OGJ150 changes
The OGJ150 group now contains 138 companies. A year ago, there were 137 firms in the compilation.
This year's OGJ150 contains 14 companies that have not been on the list before. They include Black Stone Minerals LP, Centennial Resource Development Inc., Cobalt International Energy Inc., Enduro Royalty Trust, EP Energy Corp., Extraction Oil & Gas Inc., Isramco Inc., Jagged Peak Energy LLC, Jones Energy Inc., Lonestar Resources US Inc., Magellan Petroleum Corp., MV Oil Trust, New Concept Energy Inc., and WildHorse Resource Development Inc.
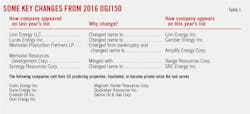
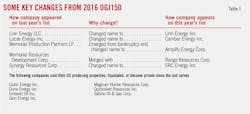
Thirteen companies that appeared a year ago are no longer included, mainly due to bankruptcy. Hydrocarb Energy Corp. and Miller Energy Resources Inc. terminated their registrations to the US Securities and Exchange Commission. Pegasi Energy Resources Corp., Petron Energy II Inc., and Red Mountain Resources Inc. are dropped from the list because of no filings in a long time. Quicksilver Resources Inc. has sold its US assets to private equity firm BlueStone Natural Resources II. Cubic Energy Inc., Emerald Oil Inc., and Sabine Oil & Gas Corp. all became private after emerging from bankruptcy. Glori Energy Inc. was liquidated. And Dune Energy Inc. has gone out business.
There also have been name changes, with some due to rebranding following emergence from bankruptcy and some for strategic shift.
Linn Energy LLC changed its name to Linn Energy Inc. Memorial Production Partners LP changed its name to Amplify Energy Corp. Memorial Resources Development Corp. merged with Range Resources Corp. Synergy Resources Corp. changed its name to SRC Energy Inc. And Lucas Energy Inc. changed its name to Camber Energy Inc.
The 2017 OGJ150 contains 8 limited partnerships. They are Breitburn Energy Partners LP, Kinder Morgan CO2 Co. LP, EV Energy Partners LP, Legacy Reserves LP, Black Stone Minerals LP, Mid-Con Energy Partners LP, Dorchester Minerals LP, and Apache Offshore. The largest LP is Breitburn Energy Partners LP, with assets of $4.11 billion at yearend 2016. The smallest LP, Apache Offshore Investment Partners, had assets of $9.4 million at yearend 2016.
There are 7 royalty trusts in the compilation. They are Enduro, VOC, MV Oil, San Juan, Cross Timbers, Sabine, and Permian Basin.
As in the previous year, there are 4 subsidiaries of non-US energy companies or of companies operating mainly in other industries. They are Seneca Resources, EQT Production, Kinder Morgan, and Wexpro.
Group financial performance
Yearend 2016 assets for the OGJ150 group totaled $1.21 trillion, a decrease of 4.14% from yearend 2015. The group's revenue for 2016 totaled $477.6 billion, down 18.29% from a year earlier.
Combined stockholder equity declined 2.73% from a year ago to $556.74 billion. Of the 138 firms, 23 posted negative stockholder equity, as their liabilities exceeded assets. Twenty-four firms reported negative stockholder equity in 2015.
As mentioned previously, the group reported a collective net loss of $47.66 billion for 2016 compared with a net loss of $141.09 billion for 2015.
A total of 99 companies posted net losses in 2016 compared with 101 in 2015 and 55 in 2014. Sixty-two companies recorded net losses exceeding $100 million compared with 72 companies in 2015 and 16 firms in 2014.
In 2016, the number of companies posting net income of over $100 million increased to 8, up from 5 companies in 2015. There were 48 such companies in 2014.
The OGJ150's 2016 capital and exploration spending fell to $87.36 billion in 2016, down from $162 billion in 2015 and $228.68 billion in 2014.
Group operations
Collectively, the OGJ150 group reported decreases in their oil and gas production in 2016 from a year earlier.
Worldwide liquids production of the OGJ150 companies decreased slightly in 2016 by 0.85% to 3.52 billion bbl. US liquids production by the group was off 2.81% at 2.14 billion bbl, marking the first decline since 2009.
OGJ150 worldwide gas production decreased 1.81% in 2016 to 17.56 tcf. US gas output by the group fell 2.12% to 13 tcf.
In 2016, OGJ150 worldwide liquids reserves declined 11% to 35.69 billion bbl. US liquids reserves for the group increased 0.44% to 23.2 billion bbl.
The group's worldwide gas reserves increased 0.18% to 200.15 tcf. Gas reserves in the US increased 1% to 147.65 tcf.
The number of US net wells drilled by the group last year totaled 5,814, down 49% from 11,489 a year earlier.
Top 20 companies by assets
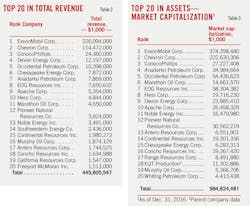
The top 20 companies as ranked by yearend 2016 assets had total assets of $1.039 trillion, down from $1.075 trillion in 2015 and $1.238 trillion in 2014. Their assets represented 85.7% of the group total for this year's OGJ150.
ExxonMobil Corp. again tops the OGJ150 group with assets of $330.31 billion at yearend 2016. At the end of 2015, the company's assets totaled $336.75 billion. Following ExxonMobil was Chevron Corp., ConocoPhillips, Anadarko Petroleum Corp., and Occidental Petroleum Corp., unchanged in rank from a year ago, and then Marathon Oil Corp., which was last year's No. 7 company.
Only one company in the top 20 was not among these leaders last year. Range Resources Corp. is now ranked No. 17, up from No. 26. Headquartered in Fort Worth, Range had yearend 2016 assets of $11.28 billion and $5.4 billion in stockholders' equity. The company's operations are focused in stacked-pay projects in the Appalachian basin and North Louisiana.
Rice Energy Inc. a year ago was ranked No. 38, but now is No. 21, as the Canonsburg-based company's assets at the end of 2016 totaled $7.82 billion. In 2017, Pittsburgh-based EQT Corp. had reached a deal to acquire Rice Energy.
The top 20 received revenues of $444 billion in 2016, down from $539 billion in 2015 and $850 billion in 2014. This was 92% of total revenues for this year's OGJ150.
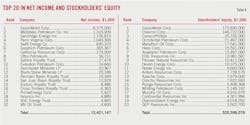
The top 20 companies posted a collective loss of $24.69 billion in 2016 compared with a combined loss of $55.11 billion a year earlier. In 2016, the top 20's loss accounted for 52% of the group total. A year earlier, this ratio was 39%.
Total stockholders' equity for the top 20 was $511.87 billion in 2016, down 4.3% from 2015 and representing 92% of the OGJ150 total.
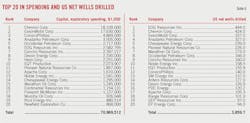
Capital and exploration expenditures by the top 20 companies in 2016 accounted to $69.94 billion, down from $124.64 billion in 2015 and $175.8 billion in 2014. This was 80% of the OGJ150 capital spending in 2016.
The top 20 companies drilled 3,657 net wells in the US in 2016, down from 6,904 in 2015 and 10,289 in 2014. In 2016, this was 62% of net wells drilled by the OGJ150 group of companies.
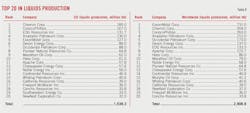
The top 20 companies' worldwide liquids production declined slightly in 2016 by 0.69%, totaling 2.86 billion bbl, while their liquids production in the US declined 3.43% to 1.48 billion bbl. The top 20 companies accounted for 80.5% of the group's worldwide liquids production and 68.4% of the US liquids production.
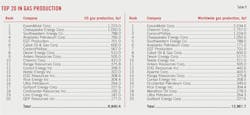
The top 20 companies' worldwide gas production declined 1.56% in 2016, totaling 12.26 tcf, and their gas production in the US declined 1.87% to 7.76 tcf. The top 20 companies accounted for 69.8% of the group's worldwide gas production and 59.4% of the US gas production.
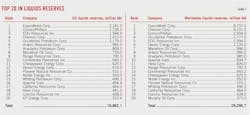
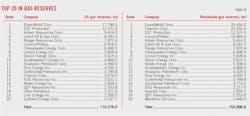
The 20 biggest companies held 81.3% of the OGJ150 group's worldwide liquids reserves and 71% of US liquids reserves in 2016. They also held 72.2% of the group's worldwide gas reserves and 62.5% of US gas reserves.
Leaders in revenues, earnings
The OGJ150 ranks the companies not only by assets but also by revenues, earnings, capital spending, and other gauges.
The top four companies as ranked by 2016 revenues are ExxonMobil, Chevron, ConocoPhillips, and Devon Energy Corp. ExxonMobil posted revenue of $226 billion in 2016, down from revenue of $268 billion in 2015.
ExxonMobil announced 2016 net earnings of $8.37 billion compared with net earnings of $16.55 billion a year earlier. The company's upstream earnings were $196 million in 2016, down $6.9 billion from 2015, mainly due to lower commodity prices. The 2015 results included an asset impairment charge of $2 billion mainly related to dry gas operations in the US Rocky Mountains region.
Midstates Petroleum Co. Inc., Sandridge Energy Inc., and Penn Virginia Corp. followed ExxonMobil in the list of top earners in 2016. However, these companies all filed chapter 11 and emerged from bankruptcy in 2016. Their earnings were from reorganization items, namely gains from the cancellation of predecessor company debt upon emergence from chapter 11.
Top 20 in capex, drilling
The 20 companies in the OGJ150 group that had the largest capital spending in 2016 combined for a total of $70.97 billion, down from $127 billion a year ago in such outlays.
Chevron led the group by capital spending of $18.11 billion, down from 2015 outlays of $29.5 billion, followed by ExxonMobil, whose 2016 spending was $17.63 billion, down 37% from a year earlier.
ConocoPhillips is third with capital spending of $4.87 billion in 2016, down 52% from a year earlier, followed by Anadarko Petroleum with $3.5 billion in capital outlays. Anadarko Petroleum reported 2015 capital spending of $6.1 billion.
EOG Resources is sixth in terms of 2016 capital spending but first in the count of US net wells drilled for the year. The company reported that its 2016 net wells drilled in the US totaled 444.
With 424 net wells drilled in the US last year, Chevron is second on the list, followed by ExxonMobil and Anadarko Petroleum.
New to the list of the top 20 companies in number of US net wells drilled are SM Energy Inc., Antero Resources Corp., PDC Energy, Range Resources Corp., QEP Resources Inc., and EP Energy Corp. They replaced Southwestern Energy, Linn Energy LLC, California Resources Corp., Whiting Petroleum, EQT Production, and Hess Corp, which were on this list a year earlier.
The total US net wells drilled by these 20 firms that drilled most during 2016 was 3,860. This compared to 7,501 in 2015 and 11,991 in 2014.
Top 20 in oil production, reserves
ExxonMobil tops the OGJ150 companies in reserves of crude, condensate, and NGL both in the US and worldwide. In the US, the company's liquids reserve total 2.18 billion bbl, followed by ConocoPhillips' 1.73 billion bbl, and EOG Resources' 1.58 billion bbl. Chevron is No. 4 on this list with 1.4 billion bbl.
Antero Resources Corp. has moved to No. 6 in terms of its liquids reserves in the US, which total 995 million bbl in 2016. In the previous edition of the OGJ150, Antero Resources was eleventh on the list with US oil reserves at 613 million bbl.
ExxonMobil's worldwide liquids reserves were 8.74 billion bbl in 2016, down from 12.95 billion bbl reported a year earlier. Chevron's worldwide liquids reserves are the second-highest, totaling 4.13 billion bbl, followed by ConocoPhillips with 2.5 billion bbl.
With 185 million bbl of output, Chevron produced the most liquids in the US during 2016, followed by ConocoPhillips and EOG Resources. But worldwide, ExxonMobil produced the most liquids, followed by Chevron and ConocoPhillips. These rankings are unchanged from a year ago.
Gas production, reserves leaders
ExxonMobil leads the OGJ150 group in US gas reserves, although it reported a decline in US gas reserves to 17.78 tcf in 2016 from 19.38 tcf a year earlier. EQT Production, which held the third largest US gas reserves previously at 9.11 tcf, is now second with 12.33 tcf. Antero Resources' gas reserves in the US now ranked at No.3 with 9.41 tcf, down slightly from 9.53 tcf a year earlier.
With 33.43 tcf, ExxonMobil is also the leading OGJ150 company in term of worldwide gas reserves, followed by Chevron, EQT production, and ConocoPhillips.
ExxonMobil produced 1.22 tcf of gas in the US last year, followed by Chesapeake Energy Corp. with 1.05 tcf, and Southwestern Energy Co. with 788 bcf. Anadarko Petroleum is fourth as ranked by US gas production, with 766 bcf produced last year.
ExxonMobil also posted the most worldwide gas production among the OGJ150 companies with 2.53 tcf last year, followed by Chevron, ConocoPhillips, and Chesapeake Energy.
Fast-growing companies
The list of fastest-growing companies ranks firms based on growth in stockholder equity. For a company to appear on this list, it must have posted positive net income in both 2016 and 2015, and it must have had an increase in net income in 2016. Limited partnerships, newly public companies, and subsidiaries are not included.
Posting a 57% boost in stockholder equity last year, Evolution Petroleum Corp. is the only company in this list this year. Evolution Petroleum recorded 2016 net income of $24 million, five times that of a year earlier. In 2016, the company realized gains of $28.1 million from the Delhi field litigation settlement, and gains of $3.4 million on derivatives. This Houston-based independent company is ranked at No. 96 by assets on the overall OGJ150 list.
About the Author
Conglin Xu
Managing Editor-Economics
Conglin Xu, Managing Editor-Economics, covers worldwide oil and gas market developments and macroeconomic factors, conducts analytical economic and financial research, generates estimates and forecasts, and compiles production and reserves statistics for Oil & Gas Journal. She joined OGJ in 2012 as Senior Economics Editor.
Xu holds a PhD in International Economics from the University of California at Santa Cruz. She was a Short-term Consultant at the World Bank and Summer Intern at the International Monetary Fund.
Laura Bell-Hammer
Statistics Editor
Laura Bell-Hammer is the Statistics Editor for Oil & Gas Journal, where she has led the publication’s global data coverage and analytical reporting for more than three decades. She previously served as OGJ’s Survey Editor and had contributed to Oil & Gas Financial Journal before publication ceased in 2017. Before joining OGJ, she developed her industry foundation at Vintage Petroleum in Tulsa. Laura is a graduate of Oklahoma State University with a Bachelor of Science in Business Administration.
