Offshore Northern Europe: Brine mixing complicates Alba field scale management
In the Alba field, UK North Sea Block 16/26, a well-by-well analysis established whether diagnostic tests can identify which wells should be treated conventionally for scale formation and which require special attention. This analysis was required because a reservoir may have various scaling regimes that require different scale management strategies in different areas of the field.
The analysis first used production data and produced brine compositions to identify recurring patterns. Then, wells were classified and grouped according to various types, and a comparison of well properties such as location within the reservoir and orientation to the flood front identify whether the well would fit in a similar well grouping. Three principal zones were identified.
The analysis also investigated the flow patterns around each well with the existing reservoir flow model. Modeling the dynamic mixing patterns throws further light on the differences between the zones, with scale dropout predicted in the aquifer in some areas and in the oil-leg in others.
Scale deposition
Sulfate scale deposition is a common problem in reservoirs where injected seawater mixes with aquifer brines.1 2 The problem is most severe in and around the producing wellbores and can cause considerable disruption to hydrocarbon production after water breakthrough.
To deal with the problem, one needs to first identify the quantity and type of scale together with the location and timing of the deposition. Secondly, a suitable removal and prevention strategy must be designed and implemented.
Both tasks require reservoir and laboratory data, and field experience is also a vital component in ensuring successful treatment. Appropriate modeling tools aid this analysis.3
Literature has described reservoir simulators for predicting the timing and location of water breakthrough and the application of scale prediction codes to identify the scaling regimes.4-9 In addition, models routinely are used in chemical scale inhibitor selection studies and to optimize inhibitor squeeze treatments.10
The evidence of both the produced brine chemistries and the flow calculations is that scale is depositing deep within the reservoir. The extent and impact of this deposition, however, varies throughout the reservoir. Important factors are the proximity of injection wells and the proximity and extent of the aquifer.
Typically, seawater contains sulfate (SO4) anions in concentrations between 2,750 and 2,900 ppm, depending on location and water temperature. When injected untreated seawater mixes with formation brines rich in cations such as barium (Ba), strontium (Sr), or calcium (Ca), the mixture may cause scale crystals to nucleate, grow, and restrict flow.
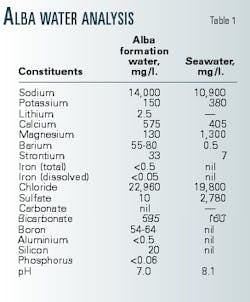
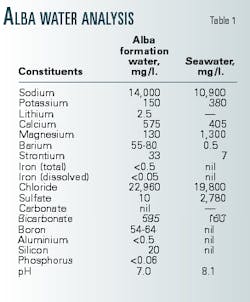
Most hydrocarbon-bearing layers contain connate formation water. Many reservoirs also have aquifers, or zones of 100% water saturation. Connate and aquifer brines in the same reservoir system will usually have similar compositions, although not always identical, as is the case in Alba (Table 1).
With incompatible reservoir and injected brines, one would expect that the first point of contact between the seawater and the formation brine is where scale deposition would occur. Indeed, unless all sulfate is removed or a scale inhibitor is added to the injected water, the immediate formation around the injection wellbore must experience scale deposition, whether the seawater is being injected into the hydrocarbon leg or the aquifer.
The change in porosity is negligible, less than 0.2%, if all scaling ions in the formation brine around the injection well precipitate and form scale in situ as a result of mixing with seawater.11 12 Furthermore, once a mixing zone is established, it will separate the rest of the unswept formation brines from seawater that is subsequently injected, and hence no more scale deposition should be expected.
Two mechanisms have been suggested that lead to mixing of brines as they approach or enter the producing wellbore, even if a bank of mixed water forms that separates injected from formation brines, within which minimal scale deposition occurs:11 13
- Areal streamlining-A well may produce faster moving seawater from one direction, probably in line with an injection well, while producing slower moving formation waters from other directions.
- Vertical segregation-Seawater may have broken through from a high permeability layer, while a lower permeability layer produces formation brines or the formation water cones from the aquifer.
In both cases, the important factor is that formation water and seawater streams converge at one point. Each stream supplies scaling ions that precipitate at that point, causing a gradual scale build up and a flow restriction. The impact on hydrocarbon flow and production can be severe whenever that point is in or near a producing wellbore. With the mixing point near the well, however, a conventional scale inhibitor squeeze treatment may inhibit crystal nucleation and growth.
Before applying the treatment, one should note if low scaling ion concentration in the produced brine may be caused by a loss of ions downhole in a scaling reaction. The hope is that a squeeze treatment will prevent scale formation and no more scale ions will be lost downhole, increasing measured ion concentrations to normal levels.
Although cation concentrations commonly return to original levels after a squeeze treatment, it is by no means universal. And yet, in some cases where original levels are not achieved after a squeeze treatment, other indicators such as well productivity, gamma ray or flow logs, or caliper tests suggest that scale deposition is not occurring.
White et al. identified lower than expected barium levels in many wells in the Alba field and raised the question of where scale deposition is occurring.14 Sorbie and MacKay further suggested that areal streamlining and vertical layering were theoretical mechanisms by which mixing may occur near the producing wellbore.11
Mackay and Sorbie applied this theory to the Alba reservoir to show the impact an aquifer has on mixing away from the wellbore.13 This work suggested that if after an inhibitor squeeze treatment the barium levels remained low, then either the inhibitor was incorrectly placed or the mixing occurs before the brines enter the treated zone, which usually extends to about 10 ft away from the wellbore.
A loss of production would accompany low barium levels if the inhibitor is in the wrong place, for example if most of it entered the formation around the heel of the well and the scaling brines came in at the toe. Alternatively, the produced water would still have low barium concentrations if the well is adequately protected but the brines are mixing at a distance from the wellbore. In this case, however, the scale will deposit relatively far from the wellbore, with little impact on production.
Other possible causes in barium level variations include incorrect ion analysis or differing compositions in formation brines, for instance between aquifer and oil-leg connate water or between isolated reservoir units. If these can be discounted, one needs to determine whether the problem is caused by an incorrect inhibitor placement or scale deposition deep within the reservoir.
Even with common features within a reservoir, one should evaluate all wells individually. Brine mixing deep within the reservoir is not a guarantee that all wells are being treated correctly and that low barium levels may be ignored. On the other hand, brine mixing and scale deposition far from the producing well may be beneficial, in that the scaling potential of the brines at the production wells will be less.
These observations suggest that one should adopt the following two-pronged approach for examining scaling regimes within a reservoir:
- Analysis of flow patterns within the reservoir as a whole with reservoir simulation of the entire field.
- Well-by-well analysis that looks at historical brine composition data and studies the flow patterns around a given well with a reservoir flow model.
This two-fold approach was applied to the Alba field.
Alba field
The Alba field overlies the Mesozoic Witch Ground graben, south of the Fladen Ground spur and north of the Renee ridge.14 15 Well 16/26-5 discovered the field in 1984. First oil production occurred in late 1994.
The 7.5 by 1-mile field trends northwest to southeast and consists of three parts: the main field, Area 15, and Area 12. The producing reservoir is of earliest Late Eocene age and is comprised of a series of stacked high-density turbidite sands that are unconsolidated and were deposited within a precut channel on an intraslope terrace.
Intrareservoir shales occur throughout the reservoir and show reworked palaeontological signatures derived from prereservoir strata out of the precut channel. Shale origin and distribution is not fully understood, and these shales typically are below seismic resolution.
The reservoir is tilted with the highest point of the top structure at about 6,080 ft in the northern end and at 6,560 ft in the southern end. Water-oil contact is at 6,465 ft, and the underlying aquifer is the shallowest in the northern end and more extensive in the southern end.
The north part of the field has a minimum production platform tied into a floating storage unit. The scale study included 25 horizontal oil producing wells, although not all currently produce. Because the Alba reservoir is highly unconsolidated, the first horizontal producers were completed with prepacked gravel screens.
Water injection through five injection wells, including a subsea injection manifold, provides reservoir pressure support. Injectors are in the main field, between one third and one half the way from the northern end of the field, and are important for determining scaling regimes throughout the field.
Alba produces a 20° API gravity crude with a 6.6-cp viscosity. Electric submersible pumps (ESPs) aid crude production.
The mixture of seawater and Alba formation water forms barium sulfate (BaSO4) scale, under the pressure, temperature (170° F.), and pH conditions of the reservoir. The maximum BaSO4 scaling potential occurs at a 1:20 seawater to formation water ratio (Table 1).15 In addition, strontium sulfate (SrSO4) may precipitate, but no calcium sulfate (CaSO4) or calcium carbonate (CaCO3) scaling occurs.
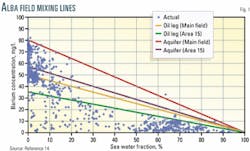
The initial barium levels vary, depending on position within the reservoir. In the main field, the oil-leg had 50 ppm barium while the aquifer had 80 ppm. In Area 15, the levels measured were 35 ppm and 58 ppm, respectively.
Brine composition
The conventional method of analyzing barium levels is to plot barium (ppm) vs. seawater fraction (% total produced water). In the simplest case without scale precipitation, this plot is a straight "mixing" line, with a maximum at 0% seawater fraction corresponding to the barium concentration in pure formation water, and a minimum of 0 ppm barium at 100% seawater.
To evaluate the barium concentration, one constructs plots for each sample for the entire field (Fig. 1), or for the specific well that produced the sample. If a point lies on the ideal mixing line, one may assume that the scaling ions have been retained in solution, and thus, no scale was deposited. But if the value is below the ideal mixing line, then one may assume that scale has precipitated somewhere in the system, either in the reservoir or in the production tubing. One, however, cannot determine the scale dropout location from this plot.
The study also included plots of other produced brine chemistry for the 25 producing wells.16 These used various ion concentrations to calculate seawater fraction. Ions analyzed included magnesium (Mg), sulfate (SO4) and boron (B). The trends for any given well were very similar, although some small quantitative differences were noted in the plots of barium vs. seawater fraction using these three methods.
Also the analysis included plots of sodium (Na), potassium (K), chloride (Cl) and strontium (Sr) vs. seawater fraction. These plots generally followed the expected trends from the mixing ratio, although some peculiar behavior was noted for potassium.16
Each well showed different behavior, however, when barium was plotted, not against seawater fraction but against watercut. Three general patterns emerged that were grouped broadly according to the reservoir region containing wells.
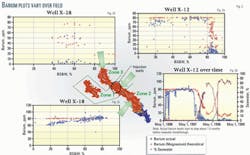
Each region, or zone, occupies about one third of the main field. Zone 1 is in the middle of the field and includes the producers immediately to the south of the injectors. Zone 2 lies further to the south, and Zone 3 is north of the injectors (Fig. 2).
Because of the reservoir dip, the volume of aquifer water in each zone increases towards the south. Wells in Area 15 show similar behavior to Zone 1 wells.
The barium vs. watercut behavior will be described by studying the results for one sample well from each zone. The plots include both the actual measured and theoretical barium concentrations. The theoretical value is for the case without any scale precipitation, and thus is affected only by seawater dilution. One calculates it from the mixing line.
The difference between the theoretical and measured values indicates the amount of scale precipitating.
Some variations between each well within a zone occurred, but space limitations in this article prevented us from presenting the results from all 25 wells studied.
In Zone 1 the producers immediately to the south of the injectors showed a behavior of increasing barium concentrations, generally starting between 50 and 60 ppm and gradually rising with increasing watercut to about 80 ppm. At a watercut between 50 and 90%, corresponding with seawater breakthrough, barium concentration drops sharply to between 0 and 20 ppm.
Fig. 2a shows that in Well X12 barium levels rise from 60 to 80 ppm, before dropping to about 5 ppm after seawater breakthrough. As barium levels drop, they can be more than 60 ppm lower than the theoretical values, but this difference tails off to less than 20 ppm.
From Fig. 2b, one can see that the barium levels start to drop 1.5 months before seawater breakthrough is measured by a change in magnesium level. This holds true even if seawater is measured by magnesium, sulfate, or boron concentrations.
In Zone 2, seawater has not yet broken through, and thus wells in this zone demonstrate the increase in barium levels, but not the sudden drops associated with seawater production. Well X18 is typical, with barium levels (Fig. 2c) rising from 60 to 80 ppm. It shows no sign of producing seawater at 80% watercut. As a result, the measured barium concentrations remained above the theoretical values predicted from the mixing line.
In Zone 3, the barium level behavior is different. Many wells in this zone show low concentrations, even at low water cuts (Fig. 2d). Well X28, within 1 month, had water breaking through at 60% watercut. For a period of 1.5 months, barium levels between 40 and 60 ppm were recorded as watercut varied between 40 and 60%. But afterwords, all reading fell below 10 ppm, even though 20-50 ppm were expected, based on the mixing line.
Brine composition
Analysis of Zones 1 and 2 suggests that before seawater breakthrough, an increasing proportion of the produced water is from the aquifer. This can be deduced from the barium level increases in each case from the oil-leg concentration of 50-60 ppm to the aquifer concentration of 80 ppm.
This implies that as the waterflood develops, an increasing proportion of the produced water is aquifer brine, and thus the majority of the injected water is sweeping through the aquifer. If the injected water were displacing mainly oil-leg connate water, then the barium levels would not be expected to increase.
The drop in barium levels shortly before seawater breakthrough is difficult to explain. The implication is that brine produced immediately prior to detecting seawater must have lost barium due to being mixed with injected water, but that the formation brine composition otherwise has remained unchanged.
While the accuracy of detecting seawater at low fractions may be a problem, other North Sea fields provide examples of injected tracers being produced before conventional ion analysis has detected seawater.
Whatever the explanation, it is apparent that scale precipitation is occurring in the reservoir before seawater is detected at the producers. This suggests that pre-emptive squeezing would be prudent in similar systems.
Partial mixing deep within the reservoir may account for some barium losses, particularly if the injected water principally advances through the aquifer. However, there is a potential for harmful scale deposition in and around the wellbore, unless the brine has a zero barium concentration in the region within 10-15 ft of the producing wellbore.
After seawater breakthrough in Zone 1 wells, the barium levels consistently remain lower than expected from the mixing line, although they are not zero. Although wells closest to the injectors are known to experience severe crossflow,14 17 which makes correct inhibitor placement difficult, the evidence suggests that not all Zone 1 wells are inadequately protected.
This implies that partial mixing occurs in the aquifer, leading to some barium loss away from the wellbore, which is in fact beneficial. As the brines approach the producers more mixing occurs, but inhibitor chemicals should prevent further scale dropout in and around the wellbore, and thus low, but not zero barium should be measured in the produced brine.
In Zone 3 wells, the low barium levels for prolonged periods suggest that more extensive mixing is occurring within the reservoir. An explanation of why Zone 1 and Zone 3 wells should present such contrasting behavior requires more detailed analysis with reservoir simulation calculations that track the barium and sulfate concentrations and with visualization of the calculated results.
Flow modeling
A full field reservoir simulator is a standard tool for predicting production and optimizing well locations. Models with tracer tracking capabilities, however, can be adapted to track chemical species at the same time as performing the fluid flow calculations. These models may even be able to calculate a pseudo scaling potential by evaluating the product of the scaling ion concentrations in each grid cell.
Although this calculation should not be used as a quantitative predictor of scale precipitation, it may identify the location for the greatest scaling potential at any given time.
Two limitations associated with conventional finite difference simulators for these calculations are:
- Numerical dispersion that results in too much mixing of injected and formation brines.
- Inability to model the scaling reaction, and thus changes in ion concentrations are only due to dilution and not precipitation.
Bearing these limitations in mind, however, the standard history matched model of the Alba reservoir was run to track the changes in barium and sulfate concentrations that would result from the dynamic fluid flow in the reservoir. The model consists of 37,757 cells, each with areal dimensions of 200 by 200 ft, but with thicknesses varying between 15 and 105 ft.
The initial barium concentration was set to 50 ppm above the water-oil contact, and to 80 ppm in the aquifer, while the initial sulfate concentration was set to zero everywhere. The injection wells were all set to inject seawater with a sulfate concentration of 2,780 ppm.
The model provide results for the field as a whole, and for individual wells within each of the three zones.
Field results
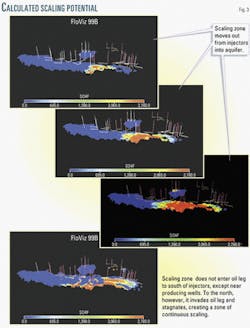
Fig. 3d shows the time steps from the dynamic plot of the region of maximum scaling potential. Features observed were:
- Injected water initially enters aquifer. The high vertical permeabilities, 3-4 darcies, lead to immediate gravity slumping of the injected brine, and whether it moves south through Zone 1 or north through Zone 3. The injected water preferentially enters the aquifer.
- In Zone 1, water advances through the aquifer. The increasing aquifer depth to the south of the injection wells means that there is sufficient flow space for the advancing water to proceed through the aquifer. Only in the vicinity of the production wells does water rise through the oil-leg due to coning.
- In Zone 1, the mixing zones propagate towards the south. The Zone 2 producing wells further to the south cause the mixing zone to advance through the aquifer in Zone 1 at a constant rate.
- In Zone 3, water advances through the oil-leg. The decreasing aquifer depth to the north of the injectors results in injected water being forced from the aquifer into the oil-leg throughout the entire zone and not only in the vicinity of the producing wells, as in Zone 1.
- In Zone 3, the mixing zone stagnates. The edge of the field is the northern boundary of Zone 3 and injected water cannot flow northwards beyond the edge. Therefore, the mixing region stagnates and spreads out instead sweeping through in a piston-like fashion, as in Zone 1.
The principal difference between Zone 1 and Zone 3 is that the region of maximum scaling potential advances uniformly and relatively quickly through the aquifer in Zone 1, only entering the oil-leg in the vicinity of the producers, whereas in Zone 3, it advances through both the aquifer and the oil-leg, spreading out at a much slower pace than in Zone 1.
The fact that injected and formation brines are in close proximity for extended periods in the one location gives rise to greater opportunity for scale precipitation, and hence explains why barium levels are consistently lower in Zone 3 wells.
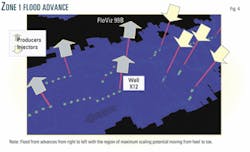
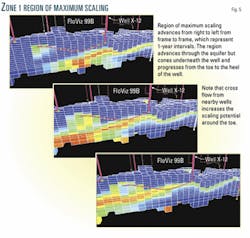
Fig. 4 shows the position of Well X12 relative to the injectors and other producers. The region of maximum scaling potential effectively sweeps through the aquifer underneath the well and rises up to travel along the well length over a 3-year period (Fig. 5). This suggests that initial squeeze treatments should concentrate on ensuring inhibitor placement around the heel of the well, while later treatments should ensure that the toe is protected.
Heel-to-toe crossflow due to the presence of neighboring injectors and producers will make the first treatments more difficult.
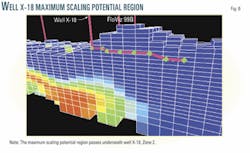
In Zone 2, the aquifer depth indicates that the region with the worst scaling potential travels largely underneath the wells (Fig. 6). This, combined with the fact that crossflow is less of a problem far from the injectors, should make these wells relatively straightforward to treat when seawater eventually breaks through.
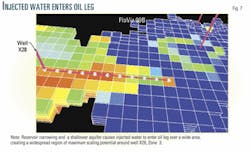
Fig. 7 shows the lateral extent of the region of maximum scaling potential in Zone 3. The entire area around the well has a mix of injected and formation brines for an extended period. The injected water has been forced into the oil-leg by the shallowness of the aquifer and the narrowing of the reservoir in the vicinity of Well X28.
Flow modeling
As noted already, the principal differences between the worst scaling regimes in Zone 1 and Zone 3 are due to location and duration. In Zone 1 and Zone 2 wells, the scaling regime will pass along the wells from heel to toe, and the impact will be mitigated by the partial loss of barium ions due to mixing in the aquifer.
The most difficult problem in Zone 1 wells will result from crossflow making placement difficult during the first treatments.
Zone 2 wells should be easier to treat because of the greater barium loss in the aquifer and less crossflow effects to contend with. Also, the aquifer volume increases to the south, so that there will be greater opportunity for the injected seawater to spread out and contact more formation brine away from the producers.
Zone 3 wells are expected to experience scaling problems for a more protracted period, and the entire length of each well will need to be protected fairly uniformly because of the widespread distribution of the maximum scaling regime. This is caused in part by the spreading of the injected seawater through the oil-leg, so that seawater is present at lower concentrations for longer periods, creating the greatest scaling potential.
While 100% of the aquifer pore space is initially occupied by 80-ppm barium brine, the oil-leg pore space only contains an initial water saturation of 7% at 55-ppm barium concentration. This means that a unit volume of aquifer pore space will contain 20 times the mass of barium ions as a unit volume of oil-leg pore space. Consequently, one would expect a greater mass of scale to be deposited in the aquifer. The time that the scaling brines are in contact with one another at low seawater concentrations, however, will increase the scale deposition. Hence, Zone 3 wells, particularly those close to the field's edge, where fluids are moving the slowest, may need regular treatments.
New wells
Zone 1 infill wells should expect to cut seawater fairly quickly and squeezing these may be difficult because of crossflow effects.
New producing wells in Zone 2 will cut seawater later and the availability of scaling ions may be reduced. The region of maximum scaling tendency, however, will move more slowly in the southern end of the field and water may be produced at low seawater concentrations for protracted periods.
In Zone 3, infill wells should only be drilled with great caution because they will probably be in a zone where extensive mixing is already taking place. Thus, scale treatment design should be in place as soon as the well starts producing.
In general, one should avoid regions where injected brines have reached low concentrations, 5-10%, but are static at these concentrations because these regions have fluids with a severe scaling tendency.
It is difficult to comment on well orientation from the results of this study because almost all Alba wells are oriented parallel to the principal flow direction. One can expect that the period of greatest scaling tendency will be shorter, but more severe, for wells oriented perpendicular to the principal flow direction and centrally located within the field because the flood front will not pass along the well, but across it. This, however, has not been tested.
The few wells not parallel to the flow direction are near the reservoir boundaries, and thus the flood front may move more slowly here, counteracting the tendency for a short scaling period suggested previously.
Different injection strategies may be required during treatment depending on whether the producer is pointing towards or away from the injection wells. If pointing away, the crossflow is liable to carry the inhibitor form heel to toe, whereas the produced fluids will probably enter around the heel, and vice versa, for wells pointing towards the injectors.
In either case, if bullheading the inhibitor, one can overcome the pressure gradients by using the maximum allowed pump rate. Wellbore friction effects will favor injection in the toe of horizontal wells. If bullheading will not be sufficiently effective (and this can be tested with appropriate calculations in the reservoir simulator), one needs to investigate suitable diversion technologies.
Because of the extensive nature of the brine mixing, one should not consider desulfurization in such systems unless it can be implement from the first day of water injection.
Observations
In many water drive reservoirs, the following four reasons may account for barium levels below the mixing line:
- Incorrect analysis of either the barium or more probably other ions used to evaluate seawater fraction. This is not a universal explanation because one can observe low barium levels and within the same reservoir some wells may have low barium levels while other wells do not.
- Change in formation brine composition as waters from different regions are produced, varying the barium levels. In fields such as Alba where aquifer barium levels are greater than those in the oil-leg connate water, the barium concentration will increase with time rather than decrease as increasing amounts of aquifer water are produced.
- Incorrect inhibitor placement may occur, for example, if inhibitor is injected mainly at the heel of a long horizontal section and scaling brines are produced at the toe. This might lead to high inhibitor returns from the heel, with scale deposition still occurring around the toe. This may explain some difficult wells, but does not explain the widespread nature of the low barium levels.
- Brine mixing prior to entering the treated zone may mean brine mixing more than 10-15 ft from the producing well.
If measured barium levels increase from concentrations found in the oil-leg connate water to concentrations found in the aquifer, then this suggests that the injected water is principally displacing aquifer water. In such systems, partial loss of barium ions in the aquifer should be expected, and this should mitigate the scaling problem.
Pre-emptive squeezing, however, should be considered for such systems because although the barium levels may be lower due to partial mixing in the aquifer, it is not uncommon for barium levels to decrease prior to the detection of seawater breakthrough, indicating the occurrence of some mixing.
Aquifer depth will determine whether the injected water can travel principally through the aquifer or oil-leg. In the aquifer, the region of maximum scaling tendency is more localized, but in the oil-leg the region typically spreads out more and has an impact for a longer time.
One should redesign squeeze treatments in wells that show consistently low barium levels but are not experiencing any loss of production. The redesign should reduce the chemical amount from that required for the theoretical barium level. Such wells should be monitored for changing barium levels, but the likelihood of an increase in barium concentration after seawater breakthrough is small.
Reservoir simulations can distinguish between wells where low barium levels result from incorrect placement during the treatment or from mixing beyond the squeeze treatment radius.
Acknowledgments
We thank Eimear Tohill, Gordon Murray, Richard White, and Richard Jones of Chevron UK Ltd. for useful discussions and access to production data, field maps, and reservoir models, and Adrian Todd for supervision of the masters in engineering project. Sponsors of the oilfield scale research group (OSRG) at Heriot-Watt University are also thanked for their support.
References
- Hinrichsen, C.J. and Edgerton, M.C., "Preventing Scale Deposition in Oil Production Facilities," presented at the IBC Fourth International Conference on Advances in Solving Oilfield Scaling, Aberdeen, Jan. 28-29, 1998.
- Oddo, J.E. and Tomson, M.T., "Why Scale Forms in the Oil Field and Methods to Prevent It," SPE Production and Facilities, February 1994, pp. 47-54.
- Mackay, E.J. and Sorbie, K.S., "An Evaluation of Simulation Techniques for Modeling Squeeze Treatments," Paper No. SPE 56775, SPE Annual Conference and Exhibition, Houston, Oct. 3-6, 1999.
- Mackay, E.J., Graham, G.M. and Sorbie, K.S., "Modeling of Scale Inhibitor Treatments in Horizontal Wells," Technical Exchange Meeting, Saudi Aramco, Saudi Arabia, May 11-13, 1998.
- Jordan, M.M., Edgerton, M., and Mackay, E.J., "Application of Computer Simulation Techniques and Solid Divertor to Improved Inhibitor Squeeze Treatments in Horizontal Wells", Paper No. SPE 50713, SPE International Symposium on Oilfield Chemistry, Houston, Feb. 16-19 1999.
- Mackay, E.J and Jordan, M.M., "Evaluation of Scale Squeeze Placement Software and an Application to a Horizontal Well Using Reservoir Simulation Calculations," 10th International Oilfield Chemical Symposium, Fagernes, Norway, Feb. 28 - Mar. 3, 1999.
- Mackay, E.J. and Sorbie, K.S., "Modeling Scale Inhibitor Squeeze Treatments in High Crossflow Horizontal Wells," Paper No. SPE 50418/CIM 98-116, The Canadian Journal of Petroleum Technology, Vol. 39, No. 10, October 2000, pp. 47-51.
- Yuan, M.D. and Todd, A.C., "Prediction of Sulfate Scaling Tendency in Oilfield Operations," SPE Production Engineering, February 1991, pp. 63-72.
- Vetter, O.J., Kandarpa, V., and Harouaka, A., "Prediction of Scale Problems Due to Injection of Incompatible Waters," JPT, February 1982, pp. 273-84.
- Graham, G.M. and Mackay, E.J., "Scale Inhibitor Selection Criteria for Downhole (Squeeze) Application in a Chalk Reservoir," 4th International Conference and Exhibition on Chemistry in Industry, Manama, Bahrain, Oct. 30-Nov. 1, 2000.
- Sorbie, K.S. and Mackay, E.J., "Mixing of Injected, Connate and Aquifer Brines in Waterflooding and its Relevance to Oilfield Scaling," Journal of Petroleum Science and Engineering, Vol. 27, No. 1-2, July 2000, pp. 85-106.
- Bertero, L., Chierici, G.L., Gottardi, G., Mesini, E., Mormino, G., "Chemical Equilibrium Models, Their Use in Simulating the Injection of Incompatible Waters," SPE Reservoir Engineering, February 1998, pp. 288-94.
- Mackay, E.J. and Sorbie, K.S., "Brine Mixing in Waterflooded Reservoirs and the Implications for Scale Prevention," Paper No. SPE 60193, 2nd SPE International Symposium on Oilfield Scale, Aberdeen, Jan. 26-27. 2000.
- White, R., Brookley, J., and Menzies, N., "Practical Experiences of Gel Diversion Technique and an Overview of Scale Management for the Alba Field," 1st SPE Symposium Oilfield Scale, Aberdeen, Jan. 27-28, 1999.
- Mackay, E.J., Matharu, A.P., Sorbie, K.S., Jordan, M.M., and Tomlins, R., "Modeling Scale-Inhibitor Treatments in Horizontal Wells, Application to the Alba Field," Paper No. SPE 63013, SPE Production & Facilities, May 2000, pp. 107-14.
- Paulo, J., "Brine Mixing and Reservoir Geometry - Implications for Scale Control," M.Eng. Thesis, Heriot-Watt University, Edinburgh, September 2000.
- Menzies, N.A., Mackay, E.J., and Sorbie, K.S., "Modeling of Gel Diverter Placement in Horizontal Wells," Paper No. SPE 56742, SPE Annual Technical Conference and Exhibition, Houston, Oct. 3-6, 1999.
The authors
A. Jeronimo Paulo is a petroleum engineer with Chevron, in Cabinda, Angola. He has worked for Chevron since 1996 as a field and petroleum engineer in various oil fields off Angola. Paulo has a degree in mechanical engineering from Agostinho Neto University, Luanda and an MEng in petroleum engineering from Heriot-Watt University, Edinburgh, Scotland.
Neil Menzies is a petroleum engineer with Chevron UK Ltd. in Aberdeen. He has been involved in completions and production engineering on the Alba field and is currently working on the subsea development of extreme south Alba. Menzies holds an MEng in petroleum engineering from Heriot-Watt University.
Eric Mackay teaches reservoir simulation in the department of petroleum engineering at Heriot-Watt University. His research interests include developing and applying numerical simulators to model oil field chemical processes, such as scale prevention and conformance control treatments. Mackay has a degree in physics from the University of Edinburgh.
Neil Poynton is well management team leader for Baker Petrolite, Aberdeen. His current duties include technical support to Aberdeen operations on downhole related issues and managing the laboratory technical function in Aberdeen. He has a BS in applied chemistry.
