Well-kill model forecasts pressure for deepwater horizontal well
Jianhong Fu
Maosen Liu
Southwest Petroleum University
Chengdu, China
Yang Chen
Sinopec Oilfield Service Corp.
Nanjing, China
Zhengli Liu
Hongshu Wei
CNOOC Co. Ltd.
Shenzhen, China
Well-control operations using the wait-and-weight method (W&W) in a deepwater horizontal well are harder to implement than in a vertical well. Simulations of well-killing procedures for future projects provide guidance to drilling engineers.
Choke-pressure variations grow more complicated as a function of time in horizontal wells. China plans to drill a deepwater horizontal well in 2017. A few deepwater horizontal wells exist worldwide but detailed information about them remains proprietary.
The authors devised a mathematical model using the W&W method for a South China Sea deepwater horizontal well. It calculates standpipe pressure (SPP), choke pressure (CP), and choke-line pressure loss (CLPL) by simulating pressure schedules under different parameters.
The model can be applied to vertical wells and directional wells by changing the coefficient of conversion from a curved borehole segment depth to vertical depth.
Well-control simulations enable drilling crews to better respond in case of kicks. Many computer models have been developed to analyze kicks. A kick simulator can forecast pressure and volume behavior of kick fluids as a function of time (OGJ, Dec. 2, 1996, p. 68).

The W&W method uses one circulation to both pump mud and kill the well. Drill-pipe pressure control is critical during this procedure.
SPP and CP schedules are more complex for a deepwater horizontal well than a vertical well. Water depth, kill rate, kick size, lateral length, and pipe size affect total well-kill time and the risk of formation fracture.
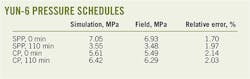
Actual kick statistics from Yun-6, a vertical well that operator China National Offshore Oil Corp. (CNOOC) drilled in 1,035 m of water in Baiyun Sag east of the South China Sea during 2008, allowed verification of simulation accuracy.
Yun-6 experienced a gas kick at 4,070 m. The crew reported a pit gain of 1.65 cu m, shut-in SPP of 4.1 MPa, and shut-in CP of 3.5 MPa. Engineers used the W&W method with water-based mud weighing 1.4 g/cu cm.
A key kick indicator is pit gain, an increased drilling mud level in the surface mud pit. This results from the kick displacing mud in the well bore. Delta flow, the difference between the mud flow into the drill pipe and that returning from the annulus, also indicates a kick.
Model assumptions
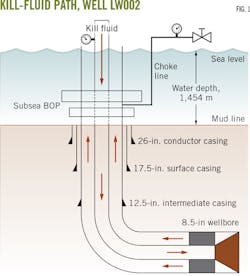
Operator CNOOC and partner Husky Energy plan to drill deepwater horizontal well LW002 in the Pearl River Mouth basin of the South China Sea. Preparations included simulations based on statistics from vertical well LW001.
LW001 and the planned LW002 are in LW3-1 gas field in 1,454 m of water. The vertical depth for LW002 is expected to be 3,715 m, the same as LW001. Both LW001 and LW002 target the LW gas reservoir.
Operator CNOOC drilled LW001, the first LW development well, in 2012 about 310 km southeast of Hong Kong. Although LW001 did not experience a kick, LW002 planners used LW001 information as the basis for well-killing simulations.
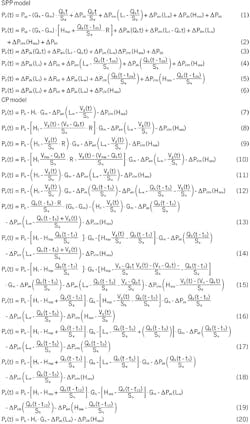
Specific formulas established the SPP and the CP schedules, which change during stages of the simulated well-kill operation (Equations 1-20). Fig. 1 shows the kill fluid's flow path.
Model development assumed:
• A kick occurs at bottomhole, forming a gas column that migrates up. Rig workers ignore both friction pressure losses and a gravitational pressure drop in the gas-column zone.1
• Workers ignore gas solubility in the kill fluid.
• The borehole has a round cross section and is concentric with the drill stem.
• Power-law patterns describe the kill fluid's rheological behavior.
• Researchers used a turbulent regime to correct for the friction factor in anticipation of frictional pressure losses.2
• Drillstring pipe volumes are larger than the annular volume below the kickoff point but smaller than the annular volume below the mud line.
Authors used wellbore heat analysis3 to compute a transient temperature profile simulation.
In the model simulations, LW002 experienced a kick when the 215.9-mm borehole reached 4,349 m. Crews used the W&W method to kill the well with the following parameters:
• Shut-in drill pipe pressure = 4 MPa.
• Kill rate = 10 l./sec.
• Original mud density = 1.17 g/cu cm
• Weighted mud density = 1.28 cu cm.
Both SPP and the CP change as a function of the kill process using the W&W method. The goal is to hold bottomhole pressure (BHP) constant with, or slightly above, formation pressure. Multiple pipe diameters complicate the SPP schedule.
BHP pressure cannot be held constant during W&W unless drilling engineers correctly calculate the SPP and CP schedules.
SPP decreases linearly when original drilling fluid in the drill string is replaced with weighted drilling fluid. Point B in Fig. 2 shows the fluid's condition at bottomhole.
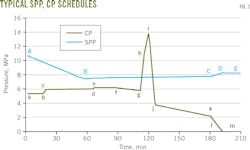
After the fluid enters the annulus, SPP increases slightly. Point C represents the point at which the fluid reaches the mud line.
Once the fluid enters the choke line, SPP increases rapidly. Point D represents the condition under which the circulated fluid reaches the rig floor. SPP stays constant after that.
CP is constant before the kick. CP builds after the kick as the gas column enters the curved borehole (Fig. 2, Points b to c). CP increases slowly while the gas column expands and rises in the curved borehole (Fig. 2, Points c to d). But CP accelerates more quickly once the gas column flows into the vertical borehole segment (Fig. 2, Points d to e).
As the gas column rises in the vertical borehole, the CP increase slows (Fig. 2, Points e to f). CP decreases gradually when the weighted drilling fluid flows into the annulus (Fig. 2, Points f to g) and rapidly increases when the gas column flows into the choke line because the cross-sectional area of the choke line is small (Fig. 2, Points g to h).
When the gas column expands and rises in the choke line, the CP increase slows. CP reaches its maximum when the gas column reaches the rig floor (Fig. 2, Point i) but decreases rapidly with fluid being continuously pumped (Fig. 2, Points i to j).
CP decreases linearly when the weighted fluid flows upward to the mud line (Fig. 2, Points j to k) with a rapid decrease when the fluid enters the choke line's small inner diameter (Fig. 2, Points k to l). CP is close to 0 when the circulated fluid reaches the rig floor and remains 0 as circulation continues (Fig. 2, Points l to m).
SPP, CP schedules
SPP and CP simulations forecast effects of choke-line length, kill rate, kick size, and lateral length.
Both pressure schedules change over time during the kill depending on choke-line length. SPP and CP peak values and total well-kill time increase with water depth. During the kill, choke-line friction pressure must be monitored to maintain constant-bottomhole pressure.
CLPL increases with the choke-line length. SPP increases with a longer choke line because gas expansion lasts longer, making a larger gas volume when the column reaches the choke valve.
A longer choke line will produce a higher CP peak value. Kill fluid flows through the choke line such that the kill takes 6 min longer in 1,500 m of water than in 1,000 m of water.
CLPL reaches maximum value when the weighted kill fluid fills the choke line. Using the W&W method, the casing-shoe pressure is 1.76 MPa greater in 1,500 m of water than in 1,000 m of water.4
Well-control crews should monitor kill rate in deeper water to avoid a built in casing-shoe pressure capable of fracturing the rock formation. Too high a pressure might damage the formation.
CP and SPP schedules change during well kills using 10-l./sec and 15-l./sec flow rates while other parameters remain constant. A higher kill flow rate resulted in a higher SPP rate and shorter kill time.
Kill rate has little effect on CP peak value. Circulation-pressure loss increases with kill rate, raising SPP as well. Kill rate also has little influence on gas expansion, resulting in almost no difference between the CP peak values when choke line lengths and kick sizes are equal.
Simulations showed kill efficiency could be improved with higher kill rates. CLPL also increases with kill rate. When the weighted kill fluid fills the choke line, the calculated casing-shoe pressure with a 15-l./sec kill rate is 1.65 MPa greater than with a 10-l./sec kill rate. Allowable casing-shoe pressure can restrict kill rate.
Kick size influences CP more than it does SPP. A larger kick size causes a higher CP peak but has little effect on SPP and total kill time.
SPP curves closely track at kick sizes of 1.5 cu m and 3 cu m because kick size has little influence on circulation pressure loss. Gas volume in the choke line, however, increases greatly with kick size. CP peak value is much greater with a kick size of 3 cu m than with a kick size of 1.5 cu m. The pressure difference reaches 5.3 MPa.
Lateral length also makes a difference. SPP and kill time are higher with a 1,000-m lateral than a 500-m lateral, but the effect on CP's peak value is small.
Longer laterals produce larger circulation-pressure losses, increasing SPP. Total well-kill time grows 26 min for a 500-m lateral increase, showing that kill time is influenced more by annular space below the mud line than by water depth. Gas volume builds in the choke line with a longer lateral.
Available information from the Yun-6 W&W-method well kill enabled SPP and CP calculations (Fig. 3).
Crews used weighted mud for the kill. The accompanying table outlines simulation calculations and field data, showing relative errors of less than 5% and confirming the simulation's reliability.
Acknowledgments
The authors would like to acknowledge the support of National Science and Technology Major Project of the Ministry of Science and Technology of China No. 2011ZX05026-001-04.
References
1. Avelar, C.S., Riberio, P.R., and Sepehrnoorki, K.K., "Deepwater Gas Kick Simulation," Journal of Petroleum Science and Engineering, Vol. 67, No. 1-2, July 2009, pp. 13-22.
2. Bourgoyne, Jr., A.T., Millheim, K.K., Chenevert, M.E., and Young, Jr., F.S., "Applied Drilling Engineering Chapter 8 Solutions," Society of Petroleum Engineers Textbook Series, Vol. 2, 1986.
3. Hagoort, J., "Ramey's Wellbore Heat Transmissions Revisited," SPE Journal Paper 87305-PA, December 2004.
4. Zhang, Z., Xiao, T.P., Fu, J.H., Xu, L.B., and Li, J.S., "Calculation Model of Deepwater Wait and Weight Method," Drilling & Production Technology, Vol. 34, No. 6, May 2011, pp. 20-22.
The authors
Jianhong Fu ([email protected]) is a petroleum engineering professor at Southwest Petroleum University's State Key Laboratory of Oil and Gas Reservoir Geology and Exploitation, Chengdu, China. He obtained his MS (1989) in petroleum engineering from Southwest Petroleum University where he became a professor in 2007. He has written some 60 papers and is studying for his PhD in petroleum engineering as an on-job doctorate at Southwest Petroleum University.
Maosen Lin ([email protected]) is a postgraduate petroleum engineering student at Southwest Petroleum University. He received a BS (2014) in petroleum engineering from Southwest Petroleum University.
Yang Chen ([email protected]) is an assistant engineer at Sinopec Oilfield Service Corp. of East China. He received an MS (2016) in petroleum engineering from Southwest Petroleum University. He specializes in deepwater well control.
Zhengli Liu ([email protected]) is a senior engineer with CNOOC's Shenzhen branch office. He received an MS (2010) in petroleum engineering from Yangtze University. He specializes in offshore drilling and completions.
Hongshu Wei ([email protected]) is a senior engineer with CNOOC's Shenzhen branch office. He received an MS (1994) in petroleum engineering from Southwest Petroleum University. He focuses on offshore drilling and completions.