Kick-prediction framework predicts offshore loss of well control
Existing loss of well control (LOWC) event indicators fall short of predicting events in an accurate and timely manner due to a lack of real-time data integration crucial for proactive risk management. A study by Louisiana State University, Blade Energy Partners, and Intellicess Inc. identified leading LOWC indicators and incorporated them into a real-time detection and response system.
Using data assimilation (DA) and change-point Bayesian networks (CP-BN) approaches, an integrated real-time kick detection and state estimation framework evaluated the effectiveness and reliability of the identified indicators. This evaluation was supported by real-time data, offline simulations, and full-scale experiments.
The integrated system showed less missed events and false alarms than stand-alone detection methods.
LOWC monitoring
Recent advancements in sensing technologies and data analytics are available for LOWC monitoring. These tools, however, have not been proven in the field. New kick detection technologies do not incorporate complex real-time scenarios and often fail to address substandard measurement availability and quality. The lack of field testing for these systems results in operational issues remaining unidentified until feedback learning trains the system.
Coupling academic research with industry acceptance of offshore LOWC leading indicator sets has been underway for more than a decade with limited success. To address this, the study underlying this article created a novel framework to integrate three technologies: a DA-based approach for real-time influx profiling, a CP-BN-oriented detection method for early anomaly recognition, and a distributed fiber-optic sensing (DFOS) system for enhanced spatial and temporal resolution in wellbore monitoring.
This integrated approach addressed the limitations of individual detection methods to provide a more robust and reliable system for early kick detection and characterization. The system optimizes offshore drilling and considers variabilities in deepwater and formation pressures.
Leading indicators for LOWC events
There is a notable lack of industry-wide consensus on standardized LOWC indicators, particularly for offshore operations. A systematic literature review identified 86 unique indicators including rig data acquisition systems (26), managed pressure drilling (MPD) systems (24), mud logging (12), controlled mud-level operations (6), measure-while-drilling (MWD) data (4), cementing (3), directional drilling (2), and other operational parameters. About 60% of the indicators are from direct readings, while others require calculated interpretations.
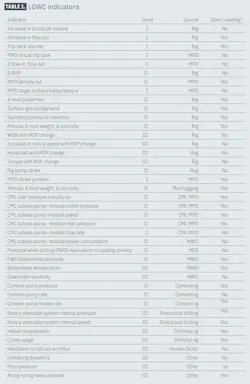
Table 1 shows indicators classified as primary (I), secondary (II), and tertiary (III). Primary indicators are the clearest signals of an anomaly in well control. Secondary indicators may be associated with a well-control event but can also signify other operational issues unrelated to well control. Tertiary indicators are only potentially linked to LOWC events and are more likely indicative of unrelated operational issues.
A 2024 survey of major operators (24%), service companies (20%), drilling contractors (12%), and other industry professionals (44%) evaluated 80 potential lead indicators across various operational domains. The results showed that 44% reported encountering well-control events occasionally (one to two times per year), while 28% faced more frequent incidents (three or more times annually).
Twenty percent of respondents had experienced significant well-control events within the past 12 months. About half of the respondents worked in both onshore and offshore environments, and about a third only had offshore operations. Only 28% reported having access to any form of automated well-control response capability.
Human factors were crucial elements in well-control event response, especially without fully automated response systems. Up to 84% of respondents identified crew training and experience as crucial elements in effective well-control management, but only one specialized service provider offered an automated response.
Effective well-control management, therefore, requires a balanced approach incorporating both technological solutions and human factor considerations. Technological advancement requires predictive algorithms and machine learning development and validation. The regulatory landscape also requires attention, focusing on developing minimum monitoring requirements based on identified primary indicators and standardizing reporting requirements for well control events.
A standardized monitoring system requires unified data collection protocols for all identified primary indicators. The identification and validation of 11 primary indicators provide a robust framework for early detection and response and a framework for an industry standard.
Combined models
Isolated single detection methods based on CP-BN, DA, or DFOS fail to capture all measurements, operational complexities, and data uncertainty encountered in offshore drilling. CP-BN identifies sudden shifts and anomalies in time-based data, such as unexpected changes in pit volume or standpipe pressure, but it does not track the location or expansion of an influx. DA-based influx profiling, however, estimates gas kick dynamics but suffers from high false alarm rates in noisy and multi-sensor conditions.
By contrast, DFOS provides real-time influx size and wellbore location during an event. DAS or DTS data supplement this analysis by providing more accurate movement of gas phases in the well than conventional rig sensors. The combination of CP-BN, DA, and DFOS leverages the strength of each component while compensating for individual limitations.
In the integrated LOWC monitoring framework, DFOS output goes into the DA-based simulator to provide continuous feedback on influx progression. The kick’s expansion through the annulus can then be tracked and predicted for control.
The CP-BN algorithm processes multiple data streams, including real-time measurement data and driller’s memos through a process which begins with natural-language processing of operational notes. The most critical, or primary, indicators, such as “increase in active pit volume” or “flow in and flow out difference,” directly informed the design of the CP-BN model.
These critical indicators came from the survey results. Advanced calculated metrics and secondary indicators, including fluid density changes, refined the CP-BN probabilistic assessments to further support the DA-based methods.
Processed data undergo measurement noise filtering before entering a time series-based CP-detection module, and the refined data streams feed into a BN model that assesses the probability of kick events. The BN model relates drilling parameters and incorporates an uncertainty quantification which allows for nuanced decisions in ambiguous situations.
In operation, CP detection provides early sensitivity to subtle distribution shifts in flow, pressure, and pit or tank signals, while a Bayesian layer combines various data, including operator annotations, into a single, explainable state description. The CP-BN model runs at the rig’s data cadence and provides an early, interpretable alarm in the workflow. Feedback loops inform future rig-condition profiling.
The DA-based profiling algorithm characterizes influx events through a two-stage process. In the prediction stage, a physics-based model generates estimates of system parameters, including pressures, velocities, volume fractions, and densities. The subsequent correction stage utilizes an extended Kalman filter (EKF)—a device to estimate mean and covariance in nonlinear systems—to update these predictions based on real-time measurement data.
This process uses statistical updating to maintain accuracy regardless of noise, bias, and model mismatch. Typical states include pressure and phase holdup along the wellbore, and typical measurements include surface flow, surface pressure, downhole pressure, and downhole temperature where available. This method estimates quantities which are not directly measured, such as influx rate, total influx volume, and the evolving distribution. It also provides uncertainty for operator review.
DFOS provides spatial and temporal wellbore monitoring and addresses the difficulty of obtaining continuous and high-resolution data from conventional sensors. The DFOS analysis algorithm uses both time and frequency-domain techniques to extract meaningful information from the sensor data. A frequency-wavenumber transform estimates gas velocity, and these data validate and enhance outputs from both the CP-BN and DA algorithms.
The CP-BN stage completes in less than a second. DFOS has low bandwidth and processing costs, and the DA step is within 1 sec. Combined, from acquisition to alarm, the system provides real-time responsiveness using rig-site hardware without specialized equipment. False alarm reduction results from a layered detection strategy—wherein CP-BN, DA, and DFOS cross-validate potential influx signals before triggering an alert—reduces false alarms
Real-time integrated gas kick detection
Rig measurements (such as pit volume and mud flow rates) and driller’s memos are uploaded to the CP-BN network to identify anomalies and classify rig states. Upon flagging a potential gas kick, DFOS data refine the estimated influx size and location while the DA-based module assimilates this continuous spatial information into physics-based models. These models produce dynamic predictions of influx evolution as drilling conditions evolve.
The integrated feedback loop among these oversight models reduces false or missed alarms and provides operators detailed information to formulate an action plan.
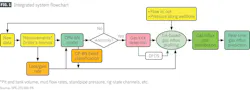
Fig. 1 shows the workflow operating on conventional rigs using pit and tank volume, flow in-flow out, standpipe pressure, and rig-state channels. The DA uses measured surface boundary conditions and DFOS provides depth-resolved constraints. The system is advisory and does not take automatic action.
The system triggers either advisory, warning, or action alarms based on CP-BN posterior levels, DA consistency checks, and DFOS indications of leading gas-edge position and movement. The alarm panel provides codes detailing the top contributing indicators and trends, the current estimate of influx size and location (with uncertainty), and a recent event timeline. Operator notes are consumed by a natural language processor to produce structured tags (e.g., connection, circulation, and choke adjustment) which update the BN database.
The operator interface displays a degraded-mode banner if data channels are missing or delayed, and the detection network proceeds with available indicators, using conservative thresholds reflecting the degraded state.
Integrated algorithm analysis
Tests conducted using Experimental Well 2 at the LSU PERTT Laboratory validated the integrated LOWC detection system by using a range of scenarios mimicking offshore drilling conditions. The installed tubing string simulated drill pipe. Tests were conducted in a 5,163-ft test well which included DTS, DAS, gas injection, downhole pressure gauges, and downhole temperature gauges (Fig. 2).
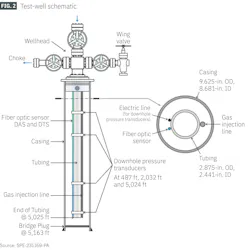
Mud was circulated via drilling pump down the tubing string and returned to the surface through the annulus. The simulated gas influx was injected into the bottom of the well through the gas injection line. Test conditions included constant casing pressure with 200 psi backpressure held by the MPD and a constant 100 gal/min rate on the mud pump to circulate gas out of the well annulus.
A custom water-based mud (WBM) system mimicked typical drilling fluids with 8.30-lbm/gal density, 15.0-cp plastic viscosity, and 16 lb/100-sq ft yield point. Recorded time-series data included casing pressure, tubing pressure, flow in and out measured by two separate Coriolos flowmeters, and the pressure of the nitrogen storage well (Well 3) supplying gas for the kick.
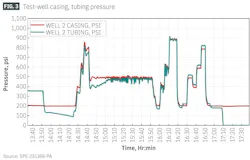
Fig. 3 shows an event at about 14:25 where pressures suddenly increased. The casing pressure pattern (red) indicates a kick event while the tubing pressure (turquoise) shows an initially interrupted rise reflecting more complex pressure dynamics in the wellbore.
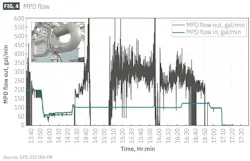
Fig. 4 shows the variation in outflow rate during the influx event while the inflow rate remains relatively stable. This differential pattern provides a key indicator of wellbore influx.
DFOS provided real-time locations of the leading and trailing edges of the migrating gas. These measurements were aligned with the electronic drilling recorder (EDR) clock and sent to the DA routine to constrain its estimate of gas migration. The DFOS data also calibrated the two- phase slippage submodel in the DA program to improve predicted phase holdup, friction, and gravitation pressure terms along the wellbore.
The DA uses these gas-column constraints and calibrated slip behavior to obtain a more accurate mass balance between surface measurements and downhole state, resulting in more stable flow rate estimates and narrower uncertainty bounds.
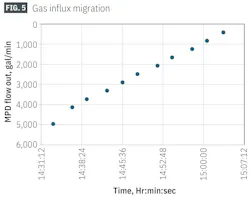
During the gas injection tests, the integrated real-time LOWC detection system continuously streamed data to a local computer at 1 hz. The framework integrated the DFOS system, the DA-based influx-profiling algorithm, and the CP-BN-based kick-detection algorithm. Fig. 5 shows the gas-influx head depth based on DFOS data during the test.
These data were fed into the integrated algorithm. The DA algorithm provided direct estimates of downhole influx rates and the CP-BN algorithm generated normalized gas-kick detection alarms based on abnormal gain beliefs.
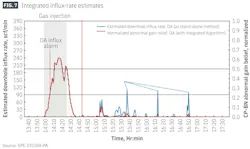
Figs. 6 and 7 compare standalone methods and the integrated algorithm in detecting and characterizing gas influx. In Fig. 6, the DA method (blue line) detected the influx at about 14:00, 10 min after injection begins. Its standalone performance, however, showed multiple false alarms between 15:30 and 17:00, likely triggered by normal flow and pressure variations.
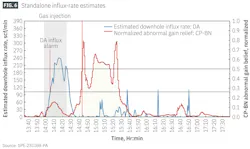
The standalone CP-BN approach (red line in Fig. 6) also showed a strong response to the event, reaching peak belief slightly past 14:40. The method was sensitive to operational noise, however, and could interpret normal operational variations as potential kick indicators.
The integrated algorithm in Fig. 7 (red line) had far less false alarms after the main injection event than the DA algorithm. It maintained accurate detection of the injection event while filtering out the signals which triggered false alarms in the standalone DA.
Historical experimental data evaluated under simulated real-time scenarios and data from an advanced drilling simulator further tested the effectiveness of the developed integrated algorithms. Both WBM and synthetic based mud (SBM) systems were evaluated in 19 scenarios spanning a wide array of drilling operations. Table 2 combines and summarizes the individual trials into similar groups.
The integrated system successfully detected gas kicks without missing any events. As with the experimental well tests, there was a significant reduction in false detection alarms using the integrated algorithm compared with standalone detection methods.

From “Enhancing Offshore Drilling Safety: Identification and Integration of Leading Indicators for Loss of Offshore Well Control,” SPE Journal, January 2026.
About the Author

Alex Procyk
Upstream Editor
Alex Procyk is Upstream Editor at Oil & Gas Journal. He has also served as a principal technical professional at Halliburton and as a completion engineer at ConocoPhillips. He holds a BS in chemistry (1987) from Kent State University and a PhD in chemistry (1992) from Carnegie Mellon University. He is a member of the Society of Petroleum Engineers (SPE).