HSE in Oil & Gas Operations Zero flaring can achieve operational, environmental benefits

A flare system can safely be designed to meet the challenge of reducing emissions to the environment as well as reducing the cost of operating the overall flare system.
This article will examine how a flare system can safely be designed to meet the challenge of reducing emissions to the environment as well as reducing the cost of operating the overall flare system.
Environmental goals
In December 1997, under the UN Framework Convention on Climate Change, governments agreed to the Kyoto Protocol, which called for an average 5.2% reduction below 1990 levels in CO2 by 2008-2012.
In translating this to UK government policy in the Department of Trade and Industry (DTI) report into sustainable development strategy, the UK government has committed to reducing greenhouse gas emissions by 12.5% below 1990 levels by 2008-12 and to move toward a goal of 20% cut in CO2 emissions below 1990 by 2010.
BP PLC's position was made clear in September 1998 when CEO Sir John Brown announced that BP would set itself a target of reducing greenhouse gas emissions to 10% below 1990 levels by 2010. This represented a 30 million tonnes cut over the same period based on business-as usual-forecasts.
The mounting environmental pressure on the oil and gas production areas to cut CO2 emissions is directly affecting the practice of flaring. Of all CO2 emissions, UK offshore flaring accounts for about 20% of CO2 production. In 1994, the UK offshore industry averaged 8.8 million cu m/day (MMcmd). More recently in 1999, an average of 5.76 MMcmd was flared, representing a rise of 3.7% over 1998 but overall a downward trend.
It is a generally accepted fact that the majority of flaring falls broadly into two equal categories, background flaring and upset-blowdown flaring. This implies that on 1999 figures in the UK alone, almost 3 MMcmd of gas could potentially have been recovered if alternative uses for that gas could be found.
Technical goals
Conventional practice has been to operate flare systems at some flow greater than the manufacturer's minimum recommended flare purge rates. Offshore, purge rates have been traditionally used to ensure visible flame exists at the flare tip.
To an observer below a vertical flare tower, this flow can appear considerable, significantly greater than minimum purge requirements. In fact, these significant but low flow rates will seriously damage flare tips and reduce operational life as a result of thermal load cycling that leads to fatigue and crack propagation.
Ensuring visible flame has been a mainstay in safe flare operation, but to achieve real environmental and cost benefit a better control is needed to satisfy safe operation. If flaring must be retained, then effective pilot monitoring and ignition, use of staged flares, and variable orifice flares will all contribute to reduce emissions.
Consideration of new ignition systems now available with low pilot-gas consumption or elimination of pilots altogether with use of newer ballistic ignition systems offers environmental and maintenance benefits.
Elimination of routine flaring will offer improved potential process stability once the spotlight is focused on the flare tip.
Economic considerations
It is difficult to consider routine flaring elimination as a purely safety or environmental issue. In all things today economic factors are significant, especially when fuel gas is short.
The value of the gas burned will vary on every installation. Indeed to place a value on the gas assumes an alternative use for that gas by injection, export, or fuel gas. If no such alternative use exists, then produced gas will have to be flared under permit.
This will become an operational cost in the future, with the operator buying CO2 permits (CO2 trading). Steps should be taken to ensure the technical flare solution is optimized ensuring maximum safety and minimum environmental damage.
Poor flare performance is often associated with incomplete combustion leading to smoke and unburned hydrocarbon emissions. Under such conditions, a review of the flare system will often lower operational cost.
Maintenance costs are often an emotive issue especially if a flare failure causes a facility shutdown. All flares suffer damage under low-flow operational conditions. Still many people assume that flares are damaged only when operating under full capacity.
In fact, under full flow conditions sonic flares operate in cool ideal conditions: The gas flashing across the flare tip cools the tip, and the flame is carried well away from the structure.
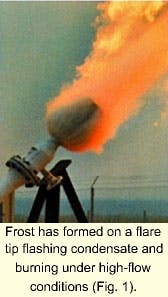
Fig. 1 shows frost formation on a flare tip flashing condensate and burning under high-flow conditions.
Most flare damage is caused by low-velocity flaring under subsonic-flow conditions when the flame is wafting around the flare tip. This causes differential heating and cooling on the steel often to temperatures up to 650° C.
The thermal cycling under these low-flow conditions becomes more severe as the heat input increases with flow rate un til the cooling effect of the cool gasses and combustion air exceeds the heat loads. It can be assumed that a pressure drop of 2-5 psi across a sonic flare tip causes the worst conditions.
Many flare designs incorporate a wind fence or flame shedder to minimize the impact of the low-velocity flame being drawn down over the main flare body on the downwind side of the flare tip.
An operation flare review will enable operators to discuss specific operational issues with a flare consultant and examine the flexibility in the operation to enhance the flare system performance to improve performance in terms of environmental, economic, and safety goals.
CO2 trading
BP now uses a form of CO2 trading internally between business units to drive improvements in emissions reduction and to prepare for when CO2 trading is more widely accepted between operators and other industries. A trading tariff of $20 (£12)/tonne CO2 is widely accepted as a starting figure for general consideration.

In a model (Fig. 2) of CO2 trading, an asset is given 50 tonnes of CO2 emissions but is predicted at 60 tonnes. Options open to the asset are to achieve operational reductions, to undertake capital projects, or to purchase additional CO2 permits.
In this way, an operator can control on a macro scale total CO2 emissions by setting quotas to assets. The operator can then seek to drive down CO2 emissions on a macro scale by annually decreasing the quotas to achieve longer term environmental goals.
On a micro (project) scale, the assets will see a real cost or benefit in reducing CO2 emissions and can justify capital project and earn extra income.
The overall economic model of flare operations can now be analyzed taking into account cost of flaring in terms of:
- Flare maintenance.
- Environmental emissions.
- Alterative gas use (export, fuel gas, etc.).
The total economic model will assist in development of cost saving and environmental improvement.
Design considerations
To reduce purge rates, flare systems should be designed to use higher blowdown pressures when available, thus keeping flare riser sizes to a minimum. Industry accepts a practical limit of 5 barg as the upper limit. This keeps the flare tip sizes lower and improves operating characteristics of the flare system. Smaller systems mean lower purge-gas rates needed to keep the process free of oxygen.
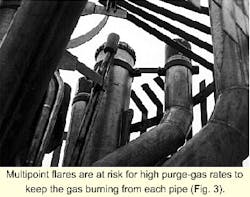
Flare design is also a significant factor in required purge gas rates. The flare design will often demand higher than minimum purge to ensure no internal combustion. Multipoint flares (Fig. 3) in particular suffer potential high purge-gas rates to keep the gas burning from each pipe.
If this is not achieved, it is feasible for air to become sucked down one part of the flare, mix with the gas, and burn within the tip elsewhere. This will inevitably lead to early failure of such a tip.
One solution has been to increase the purge-gas unit's visible flame seen on all pipes. Such a situation arose at TotalFinaElf's St. Fergus terminal, and documents published by the company showed that the flare purge rate was increased by a factor of 50-100, depending upon weather.
The flare was subsequently changed from a multi pipe solution to another proprietary design, and significant reductions in flaring were achieved.
Generally, staged systems are used onshore where large blowdown relief cases exist coupled with significant operational flare cases. A typical staged system initially designed for the ExxonMobil Corp.'s St. Fergus terminal used a first-stage variable slot Indair I33-H-VS flare tip with a larger second-stage blowdown flare tip.
The much larger Indair I-70 second-stage flare tip is designed to be lit only under relief conditions. The second-stage flare is isolated from the process by a quick-opening valve and the riser can be nitrogen-purged.
It is easy to see that even if the first stage were maintained as a lit flare for operational reasons, the elimination of purging in the much larger flare would reduce harmful emissions. This concept has been used offshore on BP's Bruce field, among others.
The first-stage flare was a variable-slot flare, which will increase backpressure under low-flow conditions and thus increase the flare efficiency.
The flares are also better able to operate at very low purge conditions without the risk of internal combustion. Significantly, a variable-slot or staged flare system affects the process by increasing backpressure under low-flow conditions, thus reducing leakage gas.
Variable-slot and staged flare systems offer significant environmental and operating cost benefits over the longer term. Their overall impact, however, is insignificant when compared to full flare-gas recovery.
Flare-gas recovery
Although flare-gas recovery is not an entirely new concept, the concept of recovery of higher-pressure gases with a closed flare was developed for the offshore market in Norway by Statoil and its Gullfaks partners. Such recovery is now patented by this group of operators and licensed to ABB Gas Technology (formally Umoe Process Technology).
As previously established, zero flaring is achievable and in many cases economically viable. Also as shown, a number of flare initiatives that use staged and variable slot flares go some way toward achieving reduced emissions.
In practice, valves will leak, and the only way to achieve a zero-flare solution is to recover waste and leaked gas from the flare knockout drum.
To achieve zero flare, ABB Gas Technology and Statoil followed a structured approach to analyze all flare sources, identify how to minimize flow, and decide on a recovery strategy.
This may involve allowing the flare knockout drum to operate at a slightly higher pressure, aiding the recovery process. The actual recovery process can involve floating higher pressure gas sources on the suction side of a compressor, the use of "spare recycle gas" as free energy in ejectors, or the use of small compressors.
Last year, the BP Forties delivery unit commissioned ABB Gas Technology to examine the BP Forties flare system. The study examined all the flare streams and delivered an analysis of various technical solutions for all four flares with cost and environmental benefits and capital expenditure required.
The four Forties platforms were largely similar in type and consisted of four flare systems-high pressure (HP), medium pressure (MP), low pressure (LP), and low low pressure (LLP)-all tied to various parts of the process. ABB Gas Technology reviewed the entire process to determine the flare sources and why the gases were released to flare.
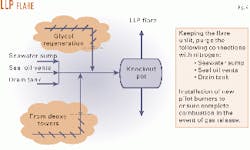
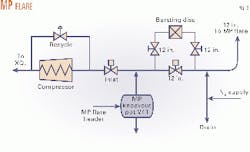
In the final analysis, the LLP flare stream (Fig. 4) represented technical difficulties in recovering the very-low-pressure gasses from some systems. The solution here was to switch these solutions to nitrogen purge and reroute other higher-pressure gasses to the LP system for recovery.
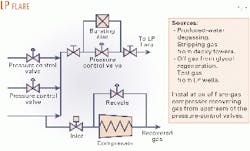
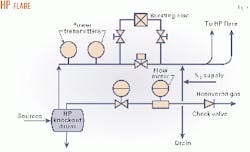
The LP and MP gas-stream solutions were to recover gas by closing the flare line (Figs. 5 and 6) and recovering through a screw compressor to the fuel-gas system. The HP system operating at a higher pressure enabled gases to be recovered by a crossover line (Fig. 7).
The approach chosen used ABB Gas Technology's experience with recovering gas from Norwegian projects coupled with the maintenance contractor's detailed knowledge of the facility. The initial structured study approach ensured all sources of gas were considered, and the overall result was tied into a BP cost model.
This fairly complicated flare system from an old platform in the UK sector demonstrated the need to evaluate fully all flare sources and look at environmental and cost benefit analysis of all the options in achieving zero flaring.
This is a complicated solution. Many others are far simpler; a few are discussed presently. The BP greenhouse gas trading model was used in the economic analysis with recovered gas valued at $20 (£12)/tonne.
The final conclusion is the installation, ongoing of flare-gas recovery on the HP and MP flare systems on Forties A and D in preparation for when the facilities become gas deficient. The compressor recovery skids on the LP and MP flares are still under consideration for a future phase of work.
This approach has now been completed on several BP facilities operating in the UK sector. As a result, equipment will be installed on the Schiehallion facility in summer 2002 to recover gas immediately. In addition, further work has been carried out for other BP prospects as well as several other operators in the UK.
Economic analysis-BP Forties
The economic analysis was rigorously completed to calculate net present value based on a number of scenarios. Although this article cannot discuss details of the technical and economic solutions for any individual project, several key benefits were established in the economic analysis demonstrating the approach taken by BP.
Following are the assumptions made in the economic analysis:
- All gas recovered was assumed to replace diesel consumption.
- One MMscfd of gas represented 28.5 tonnes of diesel.
- Diesel price was set at £140/tonne.
- Value of CO2 was set at $20/tonne, based on BP's internal trading of CO2.
- Cash flow was assumed to consist of reduced diesel consumption and the value of CO2 allowances traded.
- Cash flow was assumed constant over 10 years.
- Maintenance cost was estimated as negative cash flow; no benefit of reduced flare maintenance was taken.
- Investment cost, including installation, was assumed in year 0, and included all capital and license costs.
Under these assumptions, the total installed cost per installation was estimated at £2.7 million. The payback time for the project was slightly more than 1 year with net present value rising throughout the project to give a potential benefit of almost £14 million after 10 years.
The environmental balance of this showed positive results with average reduced flaring of 1.7 MMscfd targeted, giving a reduction of 125 tonnes/day of CO2.
These economic and environmental balances took no account of additional NGL that will become available to shore facilities, reduced "fuel miles" in diesel transport costs, and savings in maintenance and downtime associated with flare systems.
Experience in Norway
ABB Gas Technology has experience in developing similar studies and supplying full equipment packages to implement such work. Similar examples of major project successes include the following:
Gullfaks C (Fig. 8)
- Recovery of both HP and LP flare gas by ejector skids (LP: 3,000 kg/hr and HP: 3,000 kg/hr).
- Free trajectory ignition system.
- 24-in. flare line.
- Reduced flaring by 68%.
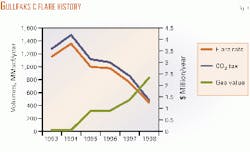
The actual reduction in flaring was significantly improved over planned reduction. Flow measurements before introduction of flare-gas recovery showed that approximately 50% of the yearly flaring was due to process upsets and that the other half of the flaring resulted from continuous flows, such as leakage, purging, and minor process upsets.
Fig. 8 shows that the recovery of gas was ramped up over time beyond the 50% level. This was attributed to a change in mentality of the operation of the facility from normally flaring to normally not flaring.
Flaring now highlighted a process upset, and such incidents encouraged an overall improvement in process stability. Now, when a flare occurrence happens, there is an enquiry into what caused the upset.
Flare-gas recovery adds to the profitability of the project, even with reducing Norwegian CO2 tax, the recovery system pays financial and environmental dividends.
- Recovery of HP flare gas by crossover line (HP: 3,000 kg/hr).
- No recovery of LP flare gas.
- Free trajectory ignition system.
- Reduced flaring 37%.
Oseberg C (Fig. 9)
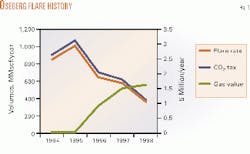
Although Oseberg A only recovered HP gas using a crossover line, the results portrayed a similar trend to the Gullfaks project. By 1998, more than $1.5 million of additional revenue was achieved in gas sales with reduced tax revenue from $3 million to only $1 million: a total financial benefit of $3.5 million and significant environmental benefit as well.
Flare-gas recovery may not be possible in all cases. There is a basic precondition that the gas recovered must be useful. Fuel-gas deficient facilities are ideal; however, future trends toward centralized power generation may make a significant impact.
Where flare-gas recovery is simply not feasible, then the best flare solutions should be considered. Staged flares with the benefit of variable orifice solutions probably offer the best all round solution. The combination of these flare systems and flare-gas recovery will yield economic and environmental benefits.
Acknowledgments
Thanks are due to the following companies for support and assistance in the preparation of this article: BP Amoco Forties Business Unit, ABB Gas Technology AS, Kaldair Ltd., and Argo Environmental Engineering Ltd.
The author

Jonathan Miles is managing director of Argo Environmental Engineering Ltd. and a specialist in offshore and onshore flares systems. He founded Argo Environmental Engineering in 1997. Previously after leaving Kaldair Ltd. in the UK, he was appointed commercial manager at SASP Ltd., a division of the Saipem SpA group. He holds an honors degree in engineering with business studies from Portsmouth University, and a post-graduate degree (1978) in offshore engineering from Robert Gordon University, Aberdeen. Miles is a chartered engineer and a member of the Institute of Marine Engineers.
Based on a presentation to the Gas Processors Convention, Mar. 12-14, 2001, San Antonio.