OGJ150 firms post improved 2017 earnings, higher reserves
Conglin Xu
Senior Editor-Economics
Laura Bell
Statistics Editor
The OGJ150 group of oil and gas producers recorded dramatically improved 2017 financial results compared with results from a year earlier, buoyed by stronger crude oil and gas prices.
In 2017, the OGJ150 group reported a combined net income of $34.86 billion compared with a combined net loss of $40.8 billion in 2016. Upstream and downstream earnings improved on higher commodity prices, benefits from US tax reform, lower impairments and other asset write-offs, asset sales, higher refining margins, and lower operating expenses.
The companies reported yearend assets totaling $1,215.5 billion. This is 1.4% greater than the 2016 total for the same group. Capital expenditures of the group jumped 18.33% in 2017 from a year ago, contributing to increased drilling activities in the US.
The OGJ150 group also recorded much higher US and worldwide liquids and gas reserves compared with a year ago.
Moreover, companies outside the top 20 by assets became more active in capital spending, drilling, and asset accumulation in 2017 compared with 2016.
To qualify for the OGJ150, oil and gas producers must be US headquartered, publicly traded, and hold oil or gas reserves in the US. Companies appear on the list ranked by total assets but are also ranked by revenues, stockholders’ equity, capital expenditures, earnings, production, reserves, and US net wells drilled.
Comparisons between totals for one year’s OGJ150 with those for another year must consider the company changes that occur. But for any given year, the OGJ list does represent a significant part of the US oil and gas industry and therefore accurately reflects trends in industry activity and financial performances.
As always, data for this year’s list reflect the prior year’s operations.
Market snapshot
The average price of Brent crude was $54.12/bbl in 2017, $43.64/bbl in 2016, and $52.32/bbl in 2015. West Texas Intermediate crude oil traded at $50.80/bbl in 2017, $43.29/bbl in 2016, and $48.66/bbl in 2015.
In 2017, the world economy grew at its quickest pace in nearly 5 years, providing strong support to oil and gas demand. The combination of healthy demand growth and production cuts of the Organization of Petroleum Exporting Countries and its non-OPEC partners reduced the surplus in global oil markets.
Due to continued low oil prices and a recovering world economy, global oil demand increased by 1.5 million b/d to 97.8 million b/d in 2017, according to the International Energy Agency’s latest data. Oil supply in 2017 is estimated at 97.4 million b/d, an increase of 400,000 b/d compared with 2016. As growth in oil demand outpaced growth in supply, global crude oil and oil products inventory decreased but remained well above the average of the last 5 years.
US crude oil production averaged 9.36 million b/d in 2017, 520,000 b/d higher than in 2016. Higher oil prices in 2017 encouraged US production to rise and drilling activity to increase, as indicated by a higher onshore oil rig count and more US net wells drilled.
Other non-OPEC production increased by 400,000 b/d and averaged 55.7 million b/d in 2017. OPEC production averaged 39.5 million b/d, 300,000 b/d less than in 2016.
Global gas demand increased by 2.4% in 2017, which is higher than the average annual growth of 2.3% in the past decade, due to weather conditions and global economic growth. Global gas production is estimated to have increased substantially in 2017, driven by Australia—supported by the start of new LNG trains, and Russia.
US domestic gas consumption, however, dropped from 27.48 tcf in 2016 to 27.1 tcf in 2017, as higher gas prices caused gas to lose market share to coal in the electric power sector. US dry gas production increased modestly in 2017, supported by higher gas and oil prices, and new gas pipeline capacity.
The US natural gas price at the Henry Hub averaged $3.11/MMbtu in 2017, 20% higher than in 2016, mainly due to less gas storage in March and November compared with the year-ago levels.
Industry gross refining margins were higher on average in 2017 than in 2016 in each of the key refining hubs of Europe, Singapore, and US.
Changes in the group
The OGJ150 group now contains 128 companies. A year ago, there were 138 firms in the compilation.
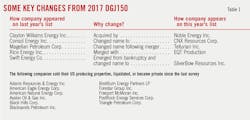
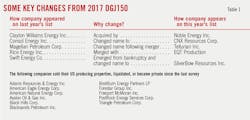
Fifteen companies listed last year dropped from the list this year due to bankruptcy, mergers and acquisitions, and other reasons (Table 1).
This year’s list contains five new companies that were not on the list in the previous year. They are Citadel Exploration Inc., Foothills Exploration Inc., Norris Industries Inc., Petrolia Energy Corp., and Rosehill Resources Inc. The highest-ranking for these, Rosehill Resources Inc., headquartered in Houston, sits at No. 81 based on yearend 2017 assets.
Seven companies on this year’s list are publicly traded limited partnerships (LP) compared with eight on the 2017 list. The largest LP this year is Kinder Morgan CO2 Co. LP, with assets of $3.95 billion at yearend 2017. The smallest LP on the list, Apache Offshore Investment Partners, had assets of $9.3 million.
There are seven royalty trusts listed this year, the same as the year before. There are four companies that are subsidiaries of non-US energy companies or of companies operating mainly in another industry.
The smallest company on this year’s list has yearend 2017 assets of $1 million vs. the smallest listee in 2016, which had assets of $1.26 million.
The minimum asset value to be included in the top 100 companies fell to $36.3 million from $67.2 million a year earlier.
Group financial performance
Supported by higher commodity prices, the OGJ150 group reported a combined net income of $34.86 billion for 2017. This compared with a combined net loss of $40.8 billion for 2016, and a combined net loss of $154 billion for 2015. In 2014, the OGJ150 posted earnings of $74 billion for 2014, when WTI oil prices averaged $93.17/bbl.
The group’s collective revenues increased 20% in 2017 to $567.8 billion. The group’s revenues totaled $474.5 billion in 2016, $582.4 billion in 2015, and $920.5 billion in 2014.
Assets for the OGJ150 group totaled $1,215.5 billion for 2017 compared with $1,198.78 billion a year ago for the same group.
Seventy-seven companies in the OGJ150 posted a profit in 2017 compared with only 18 such companies in 2016 and 19 companies in 2015. There were forty companies posting net income of more than $100 million in 2017 compared with only 7 companies in 2016 and 5 in 2015.
A total of 51 OGJ150 companies posted a net loss for 2017. This compares with 97 such companies in 2016 and 101 such companies in 2015. In 2017, 19 of the OGJ150 companies had losses exceeding $100 million compared with 108 in 2016 and 115 in 2015.
Total stockholders’ equity of the companies increased 9% from a year ago to $603.67 million in 2017.
Capital spending of the group grew 18.33% to $100.79 billion, leading to increased drilling activity, mainly in the US.
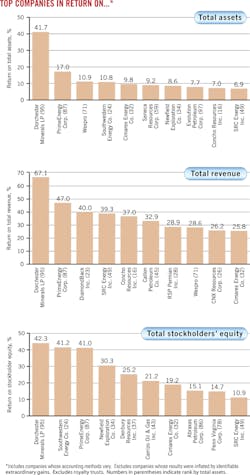
Return on assets for the OGJ150 group increased to 2.8% in 2017 from a negative 3.4% in 2016 and a negative 12% in 2015. In 2014, return on assets of the group was 5%.
Return on revenues for the OGJ150 group increased to 6.1% in 2017 from a negative 8.6% in 2016 and a negative 26% in 2015. Return on revenues was 8% for 2014.
Group operations
The OGJ150 group’s worldwide liquids production decreased slightly to 3.4 billion bbl in 2017, while US production by the group grew 4.51% to 2.2 billion bbl.
By yearend 2017, group worldwide liquids reserves increased 15.23% to 40.95 billion bbl. US liquids reserves for the group increased 16.78% to 27.93 billion bbl.
US natural gas production for the OGJ150 group decreased 3.04% to 12.22 tcf in 2017. Group worldwide natural gas production decreased 1.16% to 16.92 tcf.
Group natural gas reserves in the US increased 22.4% to 174.99 tcf in 2017. On a worldwide basis, the group booked a gas reserves increase of 16.78% to 228.24 tcf.
The group’s total US net wells drilled increased to 8,203 in 2017 from 5,745 in 2016. The combined capital and exploration expenditures increased 18.33% from a year ago to $100.79 billion.
Top 20 companies by assets
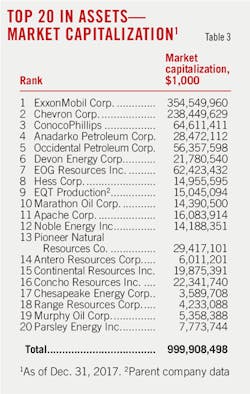
ExxonMobil Corp. as usual holds the top spot, reporting $348.69 billion in assets at yearend 2017, up from the $330.3 billion in the previous year. It is followed by Chevron Corp., ConocoPhillips, Anadarko Petroleum Corp., and Occidental Corp.
Parsley Energy Inc. is now ranked No. 20, up from No. 42 last year. Whiting Petroleum Inc. moved to No. 21 from No. 20 last year.
The top 20 companies had total assets of $1,034.28 billion at yearend 2017, representing 85% of the entire group’s assets. This compares with $1,033.56 billion for the top 20 a year ago, which accounted for 86.2% of the group’s total. Hence, a larger part of the group’s asset increases in 2017 came from companies outside the top 20 list.
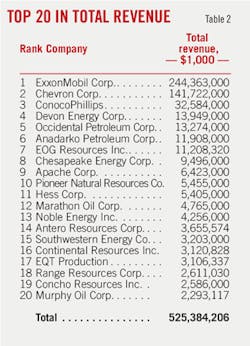
The top 20 by assets received revenues of $523.15 billion in 2017, up from $443.25 billion in 2016. Collectively, these firms posted 2017 net income of $27.58 billion compared with a combined net loss of 23.97 billion in 2016. In 2017, the revenues and net income for the top 20 were, respectively, 92.13% and 79.1% of the group total. A year ago, these ratios were 91.8% and 58.7%, respectively.
The top 20 companies by assets produced 5.2% more liquids in the US last year, totaling 1.53 billion bbl. Their liquids production worldwide dropped 1.4% to 2.79 billion bbl. Their natural gas production declined 7.83% in the US and 3.43% worldwide year-over-year.
The top 20’s liquids reserves climbed 16.11% in the US and 10.94% worldwide. Their natural gas reserves in 2017 also increased both in the US and worldwide, by 16.92% and 11.28%, respectively.
Capital and exploratory expenditures in 2017 by the top 20 totaled $73.28 billion, up from $69.9 billion in 2016. Expenditures of the top 20 amounted to 72.7% of the OGJ150 total last year. This ratio was 82% a year earlier.
The top 20 companies drilled 4,447 net wells in 2017, 758 more than in 2016 and accounting for 54% of wells drilled by the whole OGJ150 group. This is however down from 64% in 2016. Comparatively, companies outside the top 20 drilled 3,756 net wells in 2017, 1,700 more than in 2016.
Earning leaders
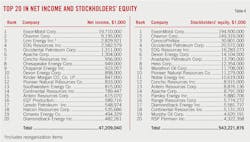
ExxonMobil, Chevron, Linn Energy Inc., EOG Resources Inc., and Oxy top this year’s list of net income leaders. Notably, 18 of the companies in this list of top earners recorded a net loss in 2016.
Chevron recorded a profit of $9.19 billion in 2017 compared with a net loss of $431 million for 2016. Upstream and downstream earnings improved on higher commodity prices, higher margins on refined products, benefits of $4.5 billion from US tax reform, asset sales, and lower depreciation expenses.
Ranked No. 42 by assets, Linn Energy is the third highest in 2017 net income that resulted from reorganization items.
EOG Resources posted earnings of $2.58 billion for 2017 vs. a net loss of 1.09 billion a year earlier. The company’s crude oil and condensate volumes in the US increased 20% in 2017 to 335,000 b/d. Increased development activity and well productivity improvements supported the volume increase.
Oxy recorded a profit of $1.31 billion compared with a net loss of $576 million in 2016. In addition to higher net sales, Oxy sold noncore acreage in the Permian basin and operations in South Texas for proceeds of $655 million. The company’s midstream and marketing segment earnings in 2017 were significantly higher than those in 2016 due to improved Permian to Gulf Coast price differentials, higher NGL prices and higher income from operating the Ingleside crude terminal. Asset impairments were 34% lower from a year ago.
Chesapeake Energy Corp. reported earnings of $949 million for 2017 compared with a net loss of $4.4 billion a year ago. The company’s total revenues increased to $9.49 billion in 2017 from $7.87 billion in 2016. Chesapeake Energy did not have an impairment for its oil and natural gas properties in 2017, but it had impairments of $2.56 billion for 2016 and $18.24 billion for 2015, respectively. The company also generated about $1.3 billion in net proceeds from the disposition of certain noncore assets and other property sales.
Ranked No. 3 by assets, ConocoPhillips posted a net loss of $855 million for 2017, following a net loss of $3.56 billion in 2016.
Top 20 in capital spending, drilling
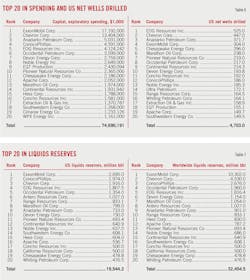
With $17.19 billion in outlays in 2017, ExxonMobil overtook Chevron and leads the OGJ150 group in capital expenditures. Chevron is the second, with $13.4 billion in expenditures, followed by Anadarko, ConocoPhillips, EOG Resources, and Oxy.
New to the list of the top 20 spenders are Extraction Oil & Gas Inc., Southwestern Energy Co., Cimarex Energy Co., and WPX Energy Inc. These four companies replace Freeport McMoRan Inc., Murphy Oil Corp., Rice Energy Inc., and Newfield Exploration Co. from last year’s top 20 spender list.
The collective outlays of the top 20 capital spending leaders totaled $74.69 billion compared with the previous top 20’s spending of $70.97 billion in 2016.
Along with the investment growth by the top 20 in spending, the top 20 companies in number of US net wells drilled reported 4,703 wells for 2017, up from 3,859 wells in 2016, in response to higher prices.
With a count of 525 wells, EOG Resources led the group in the number of net wells drilled in the US during 2017. The company also led the group for its number of net wells drilled in the US during 2016, with a count of 444.
Chevron drilled 447 net wells in the US in 2017 compared with 424 a year earlier and is the second company on the current list. Anadarko drilled 371 net wells in US last year, ranked at No. 3 and up from 327 wells drilled in 2016.
ExxonMobil drilled 304 net wells in US in 2017, down from 337 drilled a year ago.
Liquids reserves, production leaders
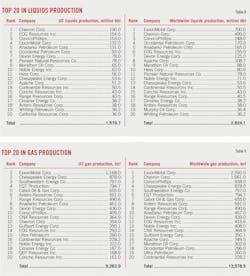
As they did a year ago, ExxonMobil, Chevron, and ConocoPhillips top the OGJ150 group in worldwide crude oil, condensate, and NGL production and reserves. Oxy is ranked fourth in terms of both worldwide liquids production and reserves.
ExxonMobil’s worldwide liquids reserves increased to 10.3 billion bbl from 8.74 billion bbl a year ago, registering the largest increase in the group. During 2017, extensions and discoveries, primarily in UAE, US, and Guyana, and purchases, primarily in US and Mozambique, resulted in the addition of proved undeveloped reserves.
Range Resources Co., No. 12 last year, switched places with Apache Resources. Range Resources’ proved oil reserves increased 18% in 2017, from 700.3 million bbl to 833.1 million bbl, as a result of continued drilling success.
Anadarko Petroleum’s liquids reserves declined from a year ago. However, the liquids share of company’s proved reserves mix increased to 63% in 2017 compared with 57% in 2016 and 52% in 2015. The reduction in proved reserves was largely a result of divesting the company’s lower-margin, noncore assets throughout the last 3 years.
ExxonMobil’s liquids reserves in the US recorded an increase of 23% in 2017 to 2.69 billion bbl, topping the group again and followed by ConocoPhillips, Chevron, and EOG.
With 190 million bbl of output, Chevron produced the most liquids in the US during 2017, followed by EOG, ConocoPhillips, ExxonMobil, and Anadarko.
Gas reserves, production leaders
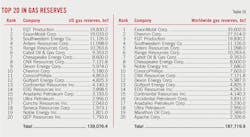
The company with the most worldwide gas reserves in 2017 is ExxonMobil, followed by Chevron, EQT Production, Southwestern Energy, and Antero Resources.
Southwestern Energy’s worldwide natural gas reserves jumped to 11,126 bcf in 2017 from 4,866 bcf in 2016. The increase was driven by a significant increase in Southwest Appalachia proved reserves.
EQT’s proved gas reserves increased 60% in 2017, primarily because of acquisitions. The company’s Marcellus assets constituted about 16.9 tcf of its total proved reserves as of yearend 2017. All its gas reserves are in the US.
Antero Resources, one of the most active operators in the Marcellus shale, increased its gas reserves to 11 tcf in 2017 from 9.4 tcf in 2016. Range Resources Corp.’s gas reserves increased to 10.22 tcf in 2017 from 7.87 tcf in 2016. All their gas reserves are in the US.
ConocoPhillips, ranked No. 4 in the list last year, is No. 10 this year. The company’s worldwide gas reserves fell to 7,603 bcf in 2017 from 10,844 bcf in 2016, due to dispositions of interests in the San Juan basin and Panhandle assets.
EQT Production leads the group in US gas reserves, followed by ExxonMobil, Southwestern Energy, Antero Resources, and Range Resources.
Following ExxonMobil in worldwide gas production are Chevron, ConocoPhillips, and Chesapeake Energy. First in US gas production for 2017 among the OGJ150 firms is ExxonMobil, followed by Chesapeake, Southwestern Energy, and EQT Production.
Fastest-growing companies
The ranking for the OGJ150 list of the fastest growing companies is based on growth in stockholders’ equity. Other qualifications are that companies are required to have positive net income for 2017 and 2016 and have an increase in net income in 2017. Subsidiary companies, newly public companies, and limited partnerships are not included.
MV Oil Trust, a statutory trust incorporated on Aug. 3, 2006, led the list this year. Its stockholders’ equity moved up 71.8% to $33.5 million and its net income increased to $14.6 million from $4.6 million in 2016. The company ranked No. 102 in the group by assets. MV Oil Trust’s major producing properties are in the El Dorado area of Kansas. The properties are mature fields that have long production histories.
Independent PrimeEnergy Corp. was ranked No. 2 on the list and No. 87 in total assets. The company presently owns properties located mainly in Texas, Oklahoma, and West Virginia.
PrimeEnegy Corp. posted increases in stockholders’ equity of 55.5% to $102.4 million and its net income increased to $41.99 million in 2017 from $3.4 million in 2016. Its long-term debt decreased to $48.46 million in 2017 from $66.3 million a year ago.
The highest-ranking company by assets on the list of fast growers is ExxonMobil, which reported an increase in stockholder equity of 11.9% and an increase in net income of $11.8 billion in 2017.
