Pipeline operators’ net incomes rise sharply
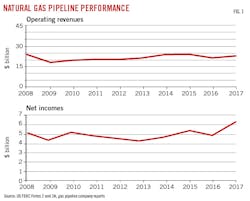
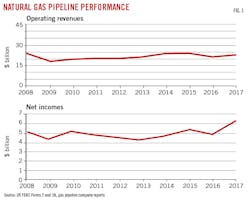
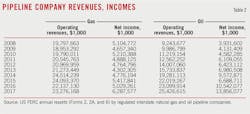
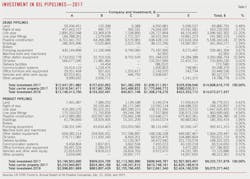
Natural gas pipeline operators’ revenues and net incomes both rose in 2017. Revenues were up for the first time since 2014, while profits surged more than 25% to reach an all-time high of nearly $6.3 billion. Additions to gas pipeline operators’ systems more than doubled from 2016, despite a sharp increase in estimated pipeline construction costs.
US oil pipeline operators’ nearly 31.5% increase in net incomes was even greater than that posted by gas operators, despite falling short of the huge 57% surge recorded in 2016. Revenues rose for the twelfth time in as many years, up more than 10% from 2016.
Details
The sharp rise in oil pipeline profits as compared with revenues saw earnings as a percent of revenue surge to nearly 54.5%. Natural gas pipeline operators experienced a more moderate version of the same phenomenon, the return to revenue growth being outstripped by rapidly rising net incomes (Fig. 1).
Proposed new-build natural gas mileage was roughly the same as 2017’s announced build, despite the higher construction costs. Compression costs increased by 11% and planned horsepower additions fell sharply.
Dramatic increases in outlays for both labor and miscellaneous expenditures were the primary drivers of higher land pipeline construction costs, labor costs more than doubling to $4 million/mile from $1.96 million/mile while estimated miscellaneous costs jumped to $4.2 million/mile from $2.4 million. Material costs were essentially unchanged at $1.3 million/mile. The roughly $4-million increase in total estimated $/mile land pipeline construction costs brought them to $9.95 million per mile, 67% more than than the prior year.
Actual land pipeline construction costs for projects completed in the 12 months ending June 30, 2018, were roughly $885,000/mile (17%) less than estimated costs. Miscellaneous costs alone were more than $900,000/mile less than estimates, higher than expected material costs more than made up for by lower labor and ROW expenses to reach the overall difference. Actual compressor station costs were 8.6% less than estimated costs for projects completed by June 30, 2018.
US pipeline data
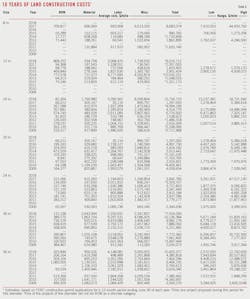
At the end of this article, two large tables (beginning on p. 68) offer a variety of data for US oil and gas pipeline companies: revenue, income, volumes transported, miles operated, and investments in physical plants. These data are gathered from annual reports filed with FERC by regulated oil and natural gas pipeline companies for the previous calendar year.
Data are also gathered from periodic filings with FERC by those regulated natural gas pipeline companies seeking FERC approval to expand capacity. OGJ keeps a record of these filings for each 12-month period ending June 30.
Combined, these data allow an analysis of the US regulated interstate pipeline system.
• Annual reports. Companies that FERC classifies as involved in the interstate movement of oil or natural gas for a fee are jurisdictional to FERC, must apply to FERC for approval of transportation rates, and therefore must file a FERC annual report: Form 2 or 2A, respectively, for major or nonmajor natural gas pipelines; Form 6 for oil (crude or product) pipelines.
The distinction between “major” and “nonmajor” is defined by FERC and appears as a note at the end of the table listing all FERC-regulated natural gas pipeline companies for 2017 at the end of this article.
The deadline to file these reports each year is in April. For a variety of reasons, companies often miss that deadline and apply for extensions, but eventually file an annual report. That deadline and the numerous delayed filings explain why publication of this OGJ report on pipeline economics occurs later in each year. Earlier publication would exclude many companies’ information.
• Periodic reports. When a FERC-regulated natural gas pipeline company wants to modify its system, it must apply for a “certificate of public convenience and necessity.” This filing must explain in detail the planned construction, justify it, and—except in certain instances—specify what the company estimates construction will cost.
Not all applications are approved. Not all that are approved are built. But, assuming a company receives its certificate and builds its facilities, it must—again, with some exceptions—report back to FERC how its original cost estimates compared with what it spent.
OGJ monitors these filings from July 1 to June 30 each year, collecting them, and analyzing their numbers.
Volumes of natural gas sold by pipelines have been steadily declining, so that, beginning with 2001 data in the 2002 report, the table only lists volumes transported for others.
The company tables also reflect asset consolidation and merger activity among companies in their efforts to improve transportation efficiencies and bottom lines.
Reporting changes
The number of companies required to file annual reports with FERC may change from year-to-year, with some companies becoming jurisdictional, others nonjurisdictional, and still others merging or being consolidated out of existence. Such changes require care be taken in comparing annual US petroleum and natural gas pipeline statistics.
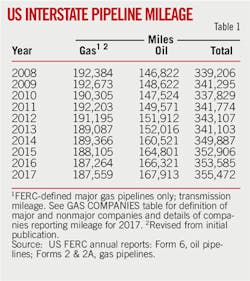
Only major gas pipelines are required to file miles operated in a given year. The other companies may indicate miles operated but are not specifically required to do so.
Reports for 2017 show an increase in FERC-defined major gas pipeline companies: 93 companies of 166 filing, from 90 of 165 for 2016.
FERC made an additional change to reporting requirements in 1995 for both crude oil and petroleum products pipelines. Exempt from requirements to prepare and file a Form 6 were those pipelines with operating revenues at or less than $350,000 for each of the 3 preceding calendar years. These companies must now file only an “Annual Cost of Service Based Analysis Schedule,” which provides only total annual cost of service, actual operating revenues, and total throughput in both deliveries and barrel-miles.
In 1996 major natural gas pipeline companies were no longer required to report miles of gathering and storage systems separately from transmission. Thus, total miles operated for gas pipelines consist almost entirely of transmission mileage.
FERC-regulated major natural gas pipeline mileage increased slightly in 2017 (Table 1), final data showing a rise of 295 miles, or 0.16%.
Rankings; activity
Natural gas pipeline companies in 2017 saw operating revenues rise by more than $1 billion or roughly 5% from 2015, reversing a large part of the previous year’s declines. Net incomes increased even more rapidly, jumping more than $1.25 billion (25%).
Oil pipeline earnings, however, rose by $3.3 billion (31.4%), the second consecutive year of at least $3-billion net income growth in the segment following a sharp decline in 2015. Revenues rose $2.3 billion or 10% (Table 2).
Crude deliveries for 2017 increased by more than 690 million bbl or 6.4%, while product deliveries rose more than 125 million bbl (1.6%).
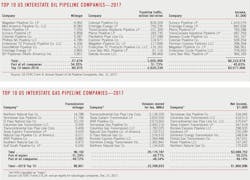
OGJ uses the FERC annual report data to rank the top 10 pipeline companies in three categories (miles operated, trunkline traffic, and operating income) for oil pipeline companies and three categories (miles operated, gas transported for others, and net income) for natural gas pipeline companies.
Positions in these rankings shift year to year, reflecting normal fluctuations in companies’ activities and fortunes. But also, because these companies comprise such a large portion of their respective groups, the listings provide snapshots of overall industry trends and events.
For instance, earnings for the top 10 oil pipeline companies rose 13% compared with the 31% overall increase, suggesting that the upswing was broad based but also that much of the slowdown in earnings growth was centered at the top of the industry. The top 10 companies’ share of the segment’s total earnings shrank accordingly, standing at 46% vs. the 53% share of earnings held in 2016.
Net income as a portion of natural gas pipeline operating revenues improved to 27% in 2017, the highest level seen in more than 10 years. The percentage of income as operating revenues for oil pipelines surged to 54.49%, the highest ever.
Net income as a portion of gas-plant investment rose to 3.72%, reversing the drop to 3.28% in 2016. Net income as a portion of investment in oil pipeline carrier property climbed to 12.39%, eclipsing 2014’s recent high of 11.3%.
Major and nonmajor natural gas pipelines in 2017 reported total gas-plant investment of roughly $170.7 billion, the highest level ever, up from $158.5 billion in 2016, $158 billon in 2015, $152 billion in 2014, about $147 billion in 2013, more than $142 billion in 2012, $138.6 billion in 2011, $124.7 billion in 2010, almost $121.3 billion in 2009, and nearly $105.8 billion in 2008.
Investment in oil pipeline carrier property continued to surge in 2017, surpassing $111.8 billion, more than double the values seen just 5 years before. Carrier property in 2016 totaled $99.5 billion, after reaching $93 billion in 2015, nearly $85 billion in 2014, $68 billion in 2013, topping $54 billion in 2012, hitting roughly $49 billion in 2011, more than $45 billion in 2010, roughly $42 billion in 2009, and $39 billion in 2008, beginning its current upward momentum in 2006 ($32.7 billion) from the lowest level seen since at least 1997, $29.5 billion in 2005.
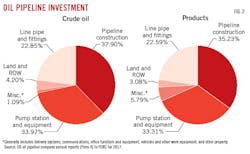
OGJ for many years has tracked carrier-property investment by five crude oil pipeline and five products pipeline companies chosen as representative in terms of physical systems and expenditures (Table 3). In 2003, we added the base carrier-property investment to allow for comparisons among the anonymous companies.
The five crude oil pipeline companies in 2017 increased their overall investment in carrier property by more than $535 million (3.8%), further slowing the gains seen the previous 4 years and lagging the segment as a whole. All companies but one increased investment in carrier property, the outlier reducing its investment by roughly $100 million.
The five products pipeline companies also saw their overall investment in carrier property slow in 2017, adding more than $258 million, or 2.85%.
Comparisons of data in Table 3 with previous years’ must be done with caution as mergers, acquisitions, and sales can make comparisons with previous years’ data difficult.
Fig. 2 illustrates how investments in the crude oil and products pipeline companies were divided.
Construction mixed
Applications to FERC by regulated interstate natural gas pipeline companies to modify certain systems must, except in certain instances, provide estimated costs of these modifications in varying degrees of detail.
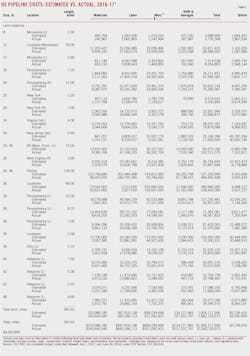
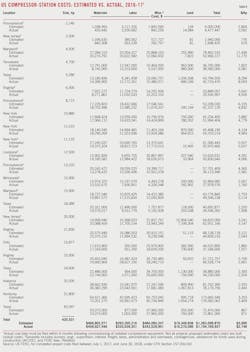
Tracking the mileage and compression horsepower applied for and the estimated costs can indicate levels of construction activity over 2-4 years. Tables 4 and 5 show companies’ estimates during the period July 1, 2017, to June 30, 2018, for what it will cost to construct a pipeline or install new or additional compression.
These tables cover a variety of locations, pipeline sizes, and compressor-horsepower ratings.
Not all projects proposed are approved. And not all projects approved are eventually built.
Applications filed in the 12 months ending June 30, 2018, were little changed from the year before.
• Roughly 545 miles of pipeline were proposed for land construction, with no offshore work submitted. The land level remained sharply lower than the nearly 2,500 miles proposed for land construction in 2016 and the 2,192 miles proposed for land construction in 2015.
• New or additional compression proposed by the end of June 2018 measured more than 287,000 hp, down sharply from the nearly 600,000 hp proposed the year before and the 2.2 million hp proposed in 2015-16.
Putting the slide in US gas pipeline construction in perspective, Table 4 lists 11 land-pipeline “spreads,” or mileage segments, and 0 marine project compared with:
• 27 land and 1 marine projects (OGJ Oct. 2, 2017, p. 71).
• 33 land and 0 marine projects (OGJ, Sept. 5, 2016, p. 89).
• 46 land and 0 marine projects (OGJ, Sept. 7, 2015, p. 114).
• 31 land and 0 marine projects (OGJ, Sept. 1, 2014, p. 122).
• 26 land and 2 marine projects (OGJ, Sept. 2, 2013, p. 117).
• 11 land and 0 marine projects (OGJ, Sept. 3, 2012, p. 118).
• 31 land and 0 marine projects (OGJ, Sept. 5, 2011, p. 97).
• 8 land and 0 marine projects (OGJ, Nov. 1, 2010, p. 108).
• 21 land and 0 marine projects (OGJ, Sept. 14, 2009, p. 66).
• 19 land and 0 marine projects (OGJ, Sept. 1, 2008, p. 58)
Two of the spreads in 2018 measured 100 miles or more, up from a single project of that scale included in the 2017 report, their combined mileage constituting the bulk of the proposed work.
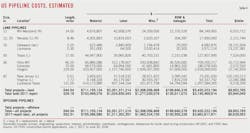
For the 12 months ending June 30, 2018, the 11 land projects filed would cost an estimated $5.4 billion, as compared with 27 land projects for $3.1 billion a year earlier.
These statistics cover only FERC-regulated pipelines. Many other pipeline construction projects were announced in the 12 months ending June 30, 2018, but may have lied outside of FERC’s jurisdiction.
A report released June 2018 on behalf of the Interstate Natural Gas Association of America concluded that the United States and Canada will require annual average midstream natural gas, crude oil, and NGL infrastructure investment of roughly $44 billion/year, or $791 billion (in 2016 dollars) total, from 2018 to 2035, up sharply from the $546 billion projected in the 2016 edition of the report. Most of this expenditure (roughly 53%) will be dedicated to natural gas development, with crude oil getting roughly 41% and NGL-related assets the remaining 6%.
Included in the $44 billion/year are:
• $15 billion/year for new oil and gas lease equipment.
• $14.7 billion/year for oil, gas, and NGL pipelines.
• $8.4 billion/year for gathering and processing investment.
• $5.8 billion/year to support refining, storage, and export activities.
The report also forecast the need for about 41,000 miles of pipeline and 7 million hp of compression and pumping to transport oil, gas, and NGLs from 2018 through 2035 and an additional 139,000 miles of gathering line and 10 million hp of compression and pumping to support gathering, processing, and storage.1
The report assumes US GDP growth of 2.1%/year, Henry Hub natural gas prices averaging $3.30/MMbtu through 2035, and West Texas Intermediate crude prices averaging $75/bbl by 2025.
Against this backdrop, estimated $/mile costs for new projects as filed by operators with FERC surged to new highs. For proposed onshore US gas pipeline projects in 2017-18 the average cost was $9.95 million/mile, up from the 2016-17 average cost of $5.9 million/mile, the $7.65 million/mile 2015-16 average costs, and the 2014-15 average cost of $5.2 million/mile. In 2013-14 the average cost was $6.6 million/mile as compared with $4.1 million/mile in 2012-13, $3.1 million/mile in 2011-12; $4.4 million/mile in 2010-11; and $5.1 million/mile in 2009-10.
Cost components
Variations over time in the four major categories of pipeline construction costs—material, labor, miscellaneous, and right-of-way (ROW)—can also suggest trends within each group.
Materials can include line pipe, pipe coating, and cathodic protection.
“Miscellaneous” costs generally cover surveying, engineering, supervision, contingencies, telecommunications equipment, freight, taxes, allowances for funds used during construction (AFUDC), administration and overheads, and regulatory filing fees.
ROW costs include obtaining rights-of-way and allowing for damages.
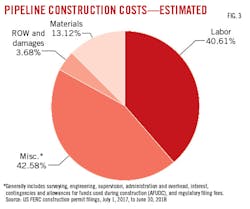
For the 11 land spreads filed for in 2017-18, cost-per-mile projections rose in all categories except material. In 2011 miscellaneous charges passed material to become the second most expensive cost category and last year they passed labor costs to become the most expensive category of all, retaining that position this year despite the cost of labor more than doubling:
• Material—$1,305,974/mile, generally flat from $1,329,414/mile for 2016-17.
• Labor—$4,042,625/mile, up from $1,955,725/mile for 2016-17.
• Miscellaneous—$4,238,543/mile, up from $2,413,224/mile for 2016-17.
• ROW and damages—$366,622/mile, up from $245,684/mile for 2016-17.
The continued rise in miscellaneous costs is driven by companies increasing the amount set aside for contingencies in their estimates.
Table 4 lists proposed pipelines in order of increasing size (OD) and increasing lengths within each size.
The average cost-per-mile for the projects rarely shows clear-cut trends related to either length or geographic area. In general, however, the cost-per-mile within a given diameter decreases as the number of miles rises. Lines built nearer populated areas also tend to have higher unit costs.
Additionally, road, highway, river, or channel crossings and marshy or rocky terrain each strongly affect pipeline construction costs.
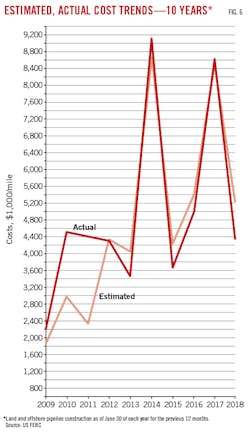
Fig. 3, derived from Table 4, shows the major cost-component splits for pipeline construction costs.
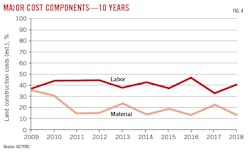
Labor is the second most expensive category and the most volatile. Labor’s portion of estimated costs for land pipelines rose to 40.61% in 2018 from 35.8% in 2017, but was below the 47.08% recorded in 2016. Labor’s portion was 37.77% in 2015, 42.36% in 2014, 38.84% in 2013, 44.61% in 2012, 44.27% in 2011, and 44.61% in 2010. Material costs for land pipelines, meanwhile, fell to 13.12% of the total, from 22.37% in 2017, 12.98% in 2016, 19.34% in 2015, 13.6% in 2014, 23.2% in 2013, 15.99% in 2012, and 14.54% in 2011.
Fig. 4 plots a 10-year comparison of land-construction unit costs for material and labor.
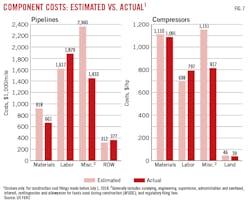
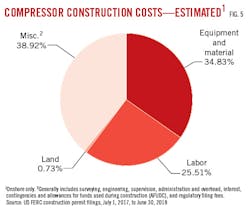
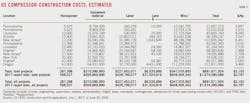
Fig. 5 shows the cost split for land compressor stations based on data in Table 5.
Table 6 lists 10 years of unit land-construction costs for natural gas pipeline with diameters ranging from 8 to 36 in. The table’s data consist of estimated costs filed under CP dockets with FERC, the same data shown in Tables 4 and 5.
Table 6 shows that the average cost per mile for any given diameter may fluctuate year-to-year as projects’ costs are affected by geographic location, terrain, population density, or other factors.
Completed projects’ costs
In most instances, a natural gas pipeline company must file with FERC what it ended up spending on an approved and built project. This filing must occur within 6 months after a pipeline’s successful hydrostatic testing or a compressor’s being put in service.
Fig. 6 shows 10 years of estimated vs. actual costs on cost-per-mile bases for project totals. The spike in both categories for 2014 and 2017 stemmed from a larger than usual proportion of the pipeline mileage completed being in high-cost urban northeast US settings.
Tables 7 and 8 show actual costs for pipeline and compressor projects reported to FERC during the 12 months ending June 30, 2018. Fig. 7, for the same period, depicts how total actual costs ($/mile) for each category compare with estimated costs.
Actual costs for pipeline construction were more than $885,000/mile less than estimated costs for the same projects. The bulk of this difference came in miscellaneous costs, which were roughly $927,000/mile (39%) less than projected for the 12 months ending June 30, 2018. Both labor and right-of-way costs were greater than estimated.
Some of these projects may have been proposed and even approved much earlier than the 1-year survey period. Others may have been filed for, approved, and built during the survey period.
If a project was reported in construction spreads in its initial filing, that’s how projects are broken out in Table 4. Completed projects’ cost data, however, are typically reported to FERC for an entire filing, usually but not always separating pipeline from compressor-station (or metering site) costs and lumping various diameters together.
The 12 months ending June 30, 2018, saw more than 420,000 hp completed, roughly 31% more than the year before. Actual compression costs were $259/hp (8.6%) lower than estimates (Table 8).
References
1. ICF International, “North American Midstream Infrastructure Through 2035; Significant Development Continues,” June 18, 2018.
About the Author

Christopher E. Smith
Editor in Chief
Chris joined Oil & Gas Journal in 2005 as Pipeline Editor, having already worked for more than a decade in a variety of oil and gas industry analysis and reporting roles. He became editor-in-chief in 2019 and head of content in 2025.