Microseismic monitoring assists reservoir understanding
The latest available geophysics technology enables operators to avoid costly completion errors, ensuring maximum, sustainable production. Microseismic monitoring in real time helps companies evaluate the effectiveness of hydraulic fracturing.
Microseismic mapping outlines the length, height, and orientation of a hydraulically-stimulated fracture network and surrounding formations.
Monitoring detects signals generated by microseismic events; small bursts of seismic wave energy created by minute rock movements during fracturing. Analysis of this seismic energy stems from earthquake seismology. Microseisms are very small earthquakes.
Geophysics service companies acquire and interpret microseismic data to help reservoir engineers plan well-placement and completion designs, contributing to increased production and recovery rates.
Peter M. Duncan, MicroSeismic Inc. president and chief executive officer, said his completions service enables better decisions about the dynamics of rock failure as the fractures are detected.
Fracture modeling calculates probable fracture size and orientation. Real-time monitoring data enable operators to rapidly change completions activities to prevent fluid loss to fracture thief zones. It also helps determine spacing for future wells, Duncan said.
“Hydraulic fracturing has been going on since the late 1940s, but most pumping was done blindly until microseismic monitoring,” he said. Early fracturing models based on pressure readings at the wellhead were simplistic and did not look anything like what really happened to the rocks.
“We used to assume fractures were symmetric about the wellbore, but sometimes fractures are only on one side,” Duncan said. “Previously, we had no eyes on what was really happening in the subsurface.”
Microseismic monitoring is like putting a stethoscope to the earth’s surface and listening to the sounds the rocks make as they are fractured. The sounds are used to create an actual image of the fractures.
Geophones
Subsurface energy is released during mechanical failure of rocks. Geophones spread out in patterns record the energy releases. Microseismic monitoring helps operators better understand the reservoir’s response to stimulation.
Research led to commercial fracturing monitoring businesses starting in the early 2000s for North Sea and east Texas projects, Duncan said. The technology yields more details than was previously available about how rocks break and where they break.
Operators use surface, near-surface, and downhole microseismic monitoring methods. Each method has advantages depending on a specific project’s circumstances. Duncan’s company specializes in surface and near-surface arrays, placing geophones on or near the surface.
“You can view an entire field rather than an individual well,” he said. This proved useful for unconventional plays because surface arrays do not require a bore hole and are not subject to high temperature issues often encountered at reservoir depths.
“Today, our analyses are a lot more geological and not just dots in a box,” Duncan said. Microseismic monitoring can tell operators about proppant movement, drainage volumes, and likely production rates. “We provide information so an operator will know how to pump each stage of his well.” He compares the information available during fracturing with having a smartmeat thermometer.
Geophones also can be placed permanently over the entire field. Cementing assures the geophones remain in place. He believes microseismic can be useful for reservoir monitoring once a field comes on stream. although MicroSeismic has yet to do this for a client.
The technology can be used for conventional production monitoring, carbon dioxide sequestration monitoring, and to watch for induced seismicity from waste injection wells, he said.
Fracturing remains the biggest market. Industry has been slow adopting microseismic monitoring, he said, adding that demand for microseismic monitoring increased tenfold during 2003-07. He estimates only about 3-5% of total wells currently being fractured are monitored.
“It is hard for an operator to correlate investment on microseismic to profits in hydrocarbons,” Duncan said. Companies tend to be more willing to use microseismic after a discovery, but he advises using it to ensure completion optimization.
For example, an oil company drilled a well 10 years ago. Fracturing only occurred on one side of the well, meaning it produced at 50% of its potential because of the inadequate completion.
“If they had not monitored that first well, they would have walked away,” Duncan said. “We map where the fractures are going and analyze their effectiveness. Operators can understand how well they are fracturing and how to increase overall production.”
Every year, Duncan’s company monitors hundreds of wells and thousands of fracturing stages. Mapping fracture networks in real time helps operators adjust treatment parameters such as pump rate.
During monitoring, MicroSeismic employees can notify an operator to stop pumping if fractures approach environmentally sensitive areas or damage a nearby well, causing that well to water out.
Monitoring also provides operators with a preventative measure to avoid penetrating groundwater aquifers. MicroSeismic records also can prove that large-magnitude events did not occur during an operator’s fracturing activities.
Looking ahead, Duncan can foresee what he calls a smart fracing platform in which artificial intelligence (AI) would analyze microseismic monitoring results and instruct the completion engineer.
“Big data algorithms would make decisions on the fly about proppant weight, pressure, and the rate that rock is taking fracturing fluid,” Duncan said. “You could use AI-based feedback to cook every stage just right.” AI applications are under development, he said.
Interpreting results
Pinnacle, a Halliburton service, said mapping of microseismic events helps operators determine reservoir characteristics. It’s important to identify the process that created the microseism before interpreting the results to ensure that accurate information is provided to the client.
The source mechanism provides important information about the fault dimension, stress drop, and seismic moment, wrote Norm Warpinski, a retired Pinnacle employee, in a technical article on the company’s web site.1
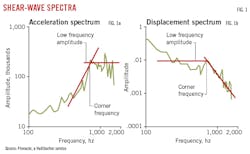
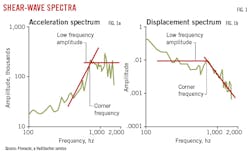
Fig. 1 shows shear-wave spectra from a microseism. Knowledge of the fault plane orientation is important because the radiation pattern is asymmetric.
Different results will be obtained depending upon where the observation point is relative to the slippage.
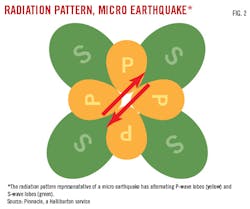
Fig. 2 shows the radiation pattern around a strike-slip representative of a micro earthquake, which has alternating P-wave (compression) and S-wave (shear) lobes. Radiation patterns can be more complicated than the example shown. For the microseism shown in Fig. 2, an observer at 90° of the microseism would detect only P waves so the event appears entirely tensile. But an observer at 45° would detect only S waves so the event appears entirely shear.
Each event requires service providers to first determine the fault plane and slip direction (source mechanism) before analyzing the waveform data. The source mechanism also provides information about natural fracture orientations used for reservoir characterization.
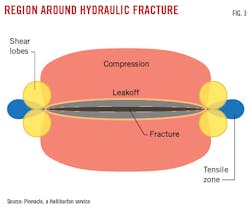
A hydraulic fracture induces a large stress perturbation due to the fracture opening and a large pore-pressure perturbation due to leakoff of high-pressure frac fluid.
Fig. 3 shows a large compressive region around the hydraulic fracture as well as a tensile zone around the tip and shear lobes that accommodates the change from tension to shear. The best situation for evaluating source mechanisms is having multiple monitoring wells, although this is not always possible, Warpinski said.
Microseismic mapping of hydraulic fractures has optimized development of the Barnett shale and tight gas sands.
Pinnacle notes that viewing distances of microseisms vary considerably from formation to formation. In the Barnett shale, microseisms only can be detected at 4,000 ft or more while the viewing distance in the Rocky Mountains typically is 1,500 ft.
Seismic stacking improves the accuracy of microseismic fracture mapping. This involves digitally stacking the signals from numerous receivers to improve the signal-to-noise ratio of the produced seismogram.
In Utah, Pinnacle used its proprietary stacking technology in a test in the Uintah basin. The monitoring distance was 1,400 ft away from the well being fractured.
Improved signal quality creates microseismic images that provide more precise locations from smaller and more distant microseisms.
Stacking enables fracture mapping in regions where mapping previously was considered difficult to complete.
Productive fracture network
ESG Solutions of Kingston, Ontario, notes that microseismic data has assisted upstream development consistently for decades, but operators face limitations in the tools enabling them to best use the data.
Sheri Bowman-Young, ESG’s senior manager of global energy services, said a microseismic data set “resembles a cloud of events. It adds value but requires a lot of work by the interpreter to decipher what it means for well production.”
ESG Solutions offers a proprietary six-step process that breaks down microseismic data, helping operators examine the relationship between subsurface variables in greater detail.
A better understanding of the productive fracture networks helps operators decide where to place wells and plan stages more strategically. It also helps them troubleshoot fluid communication issues or parent-child well interactions.
Operators use this information to reduce completion costs and increase production per pad.
ESG is a unit of Spectris PLC of Egham, UK. Spectris provides production-enhancing instrumentation and controls. ESG was founded in 1993 as Engineering Seismology Group Inc. and was associated with the Engineering Seismology Lab at Queen’s University in Kingston, which researched microseismic science.
Although it started providing microseismic monitoring for the Canadian mining industry, ESG expanded its services to oil and gas activities. The company has analyzed microseismicity to study compaction in the North Sea Ekofisk and Valhall offshore fields.2
In 1997, ESG used microseismic data to analyze hydraulic fractures in Cotton Valley shale gas fields in East Texas for Union Pacific Resources, a member of the Cotton Valley Hydraulic Fracture Imaging Consortium Project.3
The project determined microseismicity can accurately map fracture geometry, depict hydraulic fracture growth, improve fracture design (fracture models), optimize the number and location of wells (reservoir drainage), and improve production.
Since 2002, ESG has used microseismic monitoring to help map steam movement in Western Canada’s heavy oil sands.
In addition, ESG used passive seismic monitoring to track gas movement during carbon dioxide (CO2) injection in Weyburn field near Saskatchewan, Canada.4
Eight triaxial geophones were permanently deployed in an abandoned well to monitor induced seismicity in Weyburn field. The array recorded induced microseismic events immediately after CO2 injection started. The events stretched from the injection well for 50 m to a horizontal production well in which output increased.
ESG also provided microseismic monitoring for hydraulic fracture stimulations in the Horn River basin and in the Marcellus shale.
Borehole seismic data
Schlumberger Ltd.’s petrotechnical staff collaborate with operators on understanding hydraulically-induced fracture system geometry to improve well economics and optimize stimulation treatments.
Borehole-based microseismic fracture monitoring images the geometries of sets of hydraulic fractures (natural or induced) in real time, providing a 4D view of a reservoir’s flow network.
In Oman, Schlumberger and Petroleum Development Oman compared surface microseismic monitoring results with downhole-derived microseismic results. Joint inversion was studied combining both surface and downhole data. Geophysicists concluded surface and downhole data both benefit from joint inversion.5
Target depth was 1,300 m. Microseismic mapping was done for three wells monitored by both a surface array and a downhole array. Surface-acquired horizontal locations revealed the same event geometry as downhole results but with a more focused linear cloud, better defining the fracture orientation. Downhole data better defined depth variation.
Separately, Schlumberger and Marathon Oil Co. found reliable measurements of fracture pressure for microseismic interpretations can be obtained from offset observation wells and where reservoir pressure depletion causes deviations from expected fracture behavior.6
Results showed microseismic responses are directly related to fracture pressure, leading to an improved understanding of conditions in which microseismic events occur.
The study concluded hydraulic fractures cannot be defined simply as planar bi-wing fracture or complex fractures because researchers found elements of both behaviors. Planar was used to describe elastic deformation.
Microseismic events can occur anywhere that fluid pressure is present, subject to the state of stress and orientation of the failure plane with respect to those stresses.
Advances in microseismic acquisition and improved descriptions of source events require better understanding of pressure history during stimulation, Schlumberger and Marathon said. Comprehension of time-dependent behavior of hydraulic fractures could help operators improve production.
References
1. Warpinski, N., “Microseismic Source Mechanisms Must be Understood before Results Can be Accurately Interpreted,” http://www.halliburton.com/public/pinnacle/contents/Papers_and_Articles/web/H08269.pdf
2. Maxwell, S., Young R., Bossu, R., Jupe, A., and Dangerfield, J., “Microseismic Logging of the Ekofish Reservoir,” Society of Petroleum Engineers-International Society for Rock Mechanics, Rock Mechanics in Petroleum, Trondheim, Norway, July 8-10, 1998.
3. Rutledge, J., Phillips, W., House, L., and Zinno, R., “Microseismic Mapping of a Cotton Valley Hydraulic Fracture Using Decimated Downhole Arrays,” Society of Exploration Geophysicists, New Orleans, September 1998, pp. 338-341.
4. Maxwell, S., White, D., and Fabriol, H., “Passive Seismic Imaging of CO2 Sequestration at Weyburn,” SEG, Denver, Oct. 10-15, 2004.
5. Calvez, J., Zhang, J., Harrasi, O., El-Tahna, Y., Yarubi, S., and Busaidi, S., Eltilib, M., El Gihani, A., and Al-Wadhahi, T., “Combining Surface and Downhole Microseismic Monitoring: A Multi-Well Completion in Oman,” Abu Dhabi International Petroleum Exhibition and Conference, Abu Dhabi, Nov. 9-12, 2015.
6. Downie, R., Le Calvez, J., Dean, B., and Rutledge, J., “Correlation and Interpretation of the Microseismic Responses using Pressure Measurements in Offset Observation Wells,” SPE Hydraulic Fracturing Technology Conference, The Woodlands, Tex., Feb. 3-5, 2015.
About the Author
Paula Dittrick
Senior Staff Writer
Paula Dittrick has covered oil and gas from Houston for more than 20 years. Starting in May 2007, she developed a health, safety, and environment beat for Oil & Gas Journal. Dittrick is familiar with the industry’s financial aspects. She also monitors issues associated with carbon sequestration and renewable energy.
Dittrick joined OGJ in February 2001. Previously, she worked for Dow Jones and United Press International. She began writing about oil and gas as UPI’s West Texas bureau chief during the 1980s. She earned a Bachelor’s of Science degree in journalism from the University of Nebraska in 1974.


