BOEM releases 1.4-billion-pixel Gulf of Mexico bathymetry map
Tayvis Dunnahoe
Exploration Editor
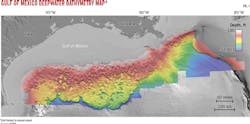
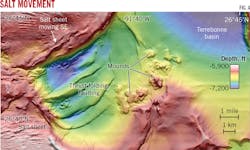
The Bureau of Ocean Energy Management (BOEM) has combined 117 of its highest quality seafloor horizons to develop a 1.4-billion-pixel bathymetry map of the US Gulf of Mexico seafloor. BOEM began mapping the Gulf of Mexico seafloor in 1998 to understand the distribution of natural hydrocarbon seeps using the acoustic amplitude response from 3D seismic data. Geological seafloor anomalies include carbonate hardgrounds, mud volcanoes, exceptionally gassy seafloor, and pockmarks. Other seafloor features which can cause anomalous amplitude responses include submarine fans and channels, exposures of salt, slope failure deposits or slumps, flows of sediment out of hydrocarbon vent sites, and Cretaceous carbonate outcrops along the Florida Escarpment. A diverse and multifaceted landscape exists, now mapped in vivid detail for the next generation to interpret.
BOEM scientists have identified and mapped nearly 35,000 water bottom (seafloor) acoustic amplitude anomalies in the deepwater northern Gulf of Mexico using 3D time-migrated seismic surveys. The purpose of this mapping program is to understand the distribution of natural hydrocarbon seeps and related benthic fauna (chemosynthetic and coral communities) in the Gulf, and to characterize other seafloor features related to the geological framework of the seafloor. Seep areas show anomalously high or low acoustic amplitude response relative to typical background, with most having overlapping seismic coverage from two or more surveys. The combined results cover more than 230,000 sq km of seismic data interpretation.
Speaking on the earliest phase of mapping the Gulf's seafloor, senior geophysicist at BOEM Bill Shedd told OGJ, "I tried to begin the bathymetry project in 2004-05 using Schlumberger's GeoFrame, but the program could not handle the volume of data we were inputting and our computers crashed repeatedly." It wasn't until the company launched its Petrel software that BOEM researchers had the capacity to begin the mapping project in earnest.
The new bathymetry map project began in 2014. BOEM had already mapped every 3D time seismic survey in the deepwater Gulf of Mexico for amplitude responses and had accumulated the X-Y-Z data for the bathymetry map.
The need to assess the environmental impact of the 2010 Macondo blowout, an unprecedented event in the deepwater Gulf of Mexico, prompted researchers to take a closer look at the Gulf's seafloor. The Natural Resource Damage Assessment (NRDA) division of the National Oceanic and Atmospheric Administration (NOAA) asked BOEM for a map of the area surrounding the Deepwater Horizon to survey its recovery.
"We achieved such a beautiful result in this area that we thought it was only natural to continue processing the bathymetry across the Gulf," Shedd said. The process yielded features that have never been recognized before.
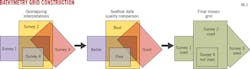
Survey comparison
It took BOEM geologist Kody Kramer a year to combine all the bureau's data into the new bathymetry grid. According to Kramer, the process was challenging because many of the surveys in the Gulf of Mexico were shot with different resolutions. BOEM holds about 2,000 surveys for the Gulf and selected 200 of the highest quality, large coverage examples for consideration in the bathymetry map. In addition to aligning a wide array of different surveys shot between 1987-2014, computer hardware and software were crucial to handling large files of different types while producing the bathymetry grid.
Grid construction began by importing the 200 individual seafloor surveys into Schlumberger's Petrel 3D software. The Gulf of Mexico is mostly covered by overlapping surveys of a variety of vintages, Kramer said, "We compared horizons to each other in areas where surveys overlap." For all overlapped horizons, the mapping team selected the best resolution interpretations and eliminated any overlapping horizons within its boundaries. The result was a mosaic of 117 of the highest quality surveys.
BOEM's bathymetry project now offers a high-resolution view of the Gulf of Mexico's seafloor to academic and industry professionals alike. "Many people have expressed interest over the years in having seafloor imagery sets," Kramer said. "We'd have to deny these many times because the original data owners would not grant permission to release the data," Kramer said.
Kramer and Shedd agreed that it was time to seek permissions for the data and develop a publicly available map to benefit further research. "This dataset is innovative because no one has combined this many 3D datasets across such a large region before," Kramer said. BOEM is the only entity which could have created this map since it maintains a database of most of the 2D-3D time and depth surveys shot in US waters.
Industry implication
According to Shedd, amplitude response is a good indicator of oil and gas seeps. Low to moderate seep sites can be viewed where bacteria in the sediment has had ample time to convert hydrocarbons to carbonate rock. Since mud volcanoes are active and young, bacteria have not had time to lithify the sediments carried to surface along with the hydrocarbons and brine. In other cases where gas has released suddenly at the seafloor and is not accompanied by sediment, depressions or pockmarks are formed. These are, however, also indicators of seep activity at some point in geologic time, according to Shedd.
While the industry has shown great interest in the map, with nearly 1,400 views of BOEM's data download site, Kramer explained that the bathymetry dataset "probably doesn't reveal any new potential hydrocarbon prospects based solely on seafloor morphology." The basins and domes in the northern Gulf of Mexico have been identified and imaged for decades and most even have formal names. But when combined with the public BOEM database of acoustic amplitude anomalies, the new data may be a useful tool for wildcatting. "We've identified known and potential natural oil and gas seeps, and the industry can see which domes and basins have probable seepage and therefore deeper prospects," Kramer said.
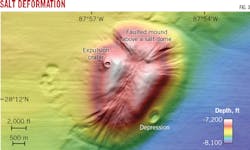
The new map shows the location of the subsurface salt with much greater resolution and precision. The geology of the Gulf of Mexico is driven by the movement of subsurface salt bodies rather than plate tectonics. Salt deposits in the region are a remnant of an ocean that existed 200 million years ago. By compacting, deforming, and ballooning into overlying material, salt deposits control the migration of hydrocarbons to both the reservoirs targeted by the oil industry with drilling and the seafloor's natural seep sites. "By overlaying BOEM's shapefiles of the potential seep sites onto the new bathymetry map, it is apparent that most of the seeps are found on the flanks and over the tops of the bathymetric highs controlled by salt diapirism," Shedd said.
The new bathymetry map clearly delineates areas of instability on the seafloor to avoid when planning drilling locations, platform installations, and pipeline routes. "There are, of course, surveys which are higher resolution and show even greater geologic detail than this new dataset," Kramer said. But surveys shot with multibeam and autonomous underwater vehicle (AUV)-mounted technology are "usually small postage stamps in relation to the larger Gulf," he added.
The new map can provide guidance before running the higher-resolution AUV surveys required for permitting planned infrastructure projects.
Technology transfer
Scientists and non-petroleum engineers can also benefit from increased seafloor resolution when studying underwater environments. The bathymetry dataset will allow for an increase in modeling precision for multiple types of studies, such as ocean bottom current and temperature modeling, benthic organism habitat mapping, and potential unstable slope modeling, among others.
The US Gulf of Mexico has been imaged more than any other region of the world and BOEM's seismic library made the new bathymetry map possible. Similar projects may be undertaken in other areas of the world with an abundance of 3D seismic coverage. "Geoscientists … have been impressed with the results and see the utility in doing the work," Shedd said.
Editor's note: The deepwater bathymetry map and seafloor acoustic anomaly downloads mentioned in this interview are available for download at BOEM's website.