New model predicts solubility in glycols
A new numerical model predicts the amount of H2S and CO2 absorbed per volume of different glycols circulated vs. the partial pressure of acid-gas components and the absorber’s temperature. The model covers the full range of dehydration-plant operating conditions and a wide range of experimental data results.
This study shows that the proposed approach is more accurate than routine equations of state approaches in predicting the solubility of acid gases in different glycols. Equation-of-state methods do a generally good job of determining vapor-phase properties, but the liquid phase is much more difficult, especially when the liquid contains dissimilar molecules and polar molecules, such as H2S, CO2, alcohols, and glycols, that are not handled easily.
This article also compares results of the proposed model with experimental data and Peng-Robinson equation-of-state results. The average absolute deviation for the proposed numerical model falls between 2 and 3%, or 2.5% on average. The equation of state’s average absolute deviation results fall between 4 and 24%, or 14% on average.
Glycols and acid gases
The numerical model offered here is a polynomial, meaning it has 16 parameters.
Glycols have a tendency to absorb acid gases. Acid-gas solubility is a major factor when considering use of a physical solvent in sour-gas dehydration plants. All glycols absorb hydrocarbons and acid gases to some extent. In most cases, hydrocarbon removal is undesirable and should be minimized. In general, the lower temperature and the higher the pressure, the more hydrocarbons and acid gases that will be dissolved in different glycols.1 In some cases, however, hydrocarbon solubility actually increases with temperature.2
Glycol dehydration of natural gas most commonly employs triethylene glycol (TEG). Diethylene glycol and ethylene glycol may also be used in dehydration applications, but they are often not considered due to failure to achieve the dry-gas water content requirements.
TEG has a higher degradation temperature and can be regenerated to a higher lean concentration with no modifications to the standard regenerator reboiler. EG and DEG, however, can meet water-content specifications when used with enhanced regeneration systems, that is, any system that improves glycol regeneration to achieve a leaner or more concentrated glycol solution.
Enhanced regeneration could be the injection of stripping gas into the reboiler, azeotropic regeneration, or other proprietary processes. The costs associated with use of EG or DEG increase because of glycol makeup and some form of enhanced regeneration are required to obtain a more concentrated glycol to achieve the dry-gas water content.3 4
From an industry prospective, estimation of acid gases and development of control technologies to mitigate the impact of these emissions on the environment have become important issues.3 4
Regeneration of the rich glycol solution liberates acid-gas components. How much of these compounds is absorbed and consequently liberated from the glycol depends on their concentrations in the wet gas being dehydrated and on the contactor’s pressure and temperature.5
In typical dehydration, the glycol is regenerated to about 99% purity or higher. The absorbed amount of acid-gas components depends on the amount of glycol circulated. If the glycol is not regenerated to this purity, then the amount of gas absorbed per unit of lean glycol circulated would be slightly less than the amount calculated by the proposed model.
Glycol will absorb some hydrocarbons at the high pressure of the contactor. Glycol has a special affinity for such cyclic hydrocarbons as benzene, toluene, ethyl benzene, and xylene (BTEX), light hydrocarbon components, as well as polar gases H2S and CO2 (acid gases).
Aromatic hydrocarbons and acid gases, however, are very soluble in glycols, and significant amounts of aromatic hydrocarbons and acid gases may be absorbed in glycols at contactor conditions. This may present an environmental or safety hazard when they are discharged from the top of the regenerator.
Regeneration of glycol flashes off all absorbed gases. From here they can be routed to fuel, flare, or gas-recovery system.3 4
The new model proposed here applies to pure glycol or to lean glycol (which is essentially pure). This numerical model shows good agreement with experimental data, which were obtained with pure glycols.
Process engineers currently use commercial software to predict the solubility of acid-gas components in TEG and DEG. These software packages use equations of state and need complete process data to simulate wet-gas dehydration plants and consequently calculate the solubility of acid gases in glycols.
It is impossible accurately to predict their solubility in glycols by routine commercial software. Moreover, this commercial software is expensive.6
Another widely used procedure employs graphics. These present a convenient visual comparison of the effect of pressure and temperature on the solubility of acid gases in glycols but are less accurate in predicting the solubility of acid gases in glycols, especially when the graphs are plotted in log scale.
Moreover, process engineers have difficulty reading a graph accurately, and modern design techniques are usually based on computer calculations. The benefit of equations is that they can easily be programmed and incorporated into an overall design program, thus bypassing the need for charts or graphs.5 7
The proposed model has been developed on the basis of experimental data.8 9
The solubility of acid-gas components in glycols is a function of temperature and partial pressure. The partial pressure is the product of the operating pressure times the mole fraction of acid-gas components in the gas in the absorber.
The amount of acid-gas components removed by the glycol depends on the following parameters:
- Mole fraction of the acid gases in the feed gas.
- Contactor operating pressure and temperature.
- Glycol circulation rate.1 5
Proposed model
The required data for using this approach include partial pressure and mole fraction of individual components in liquid phase. At first the mole fraction of components is correlated vs. partial pressure of components at different constant temperatures; then the calculated coefficients for these polynomials are correlated for different temperatures.
When the calculated coefficients are correlated for different temperatures by the least-square method in a gas dehydration plant, the tuned coefficients are calculated and used in Equations 1-4 (see accompanying box on the first page of the article). These polynomials calculate new coefficients for calculating mole fraction of individual components as a function of partial pressure so that finally the polynomial Equation 5 demonstrates the variation of mole fraction as a function of individual components’ partial pressures.

The proposed approach consists of the following steps:
- Select component (i; see accompanying nomenclature list).
- Select temperature (j).
- Correlate xi as a function of partial pressure for mole fraction and partial pressure of component (i) at temperature (j).
- Repeat Steps 2 and 3 for different partial pressures at other temperatures.
- Correlate corresponding polynomial coefficients that were obtained at different temperatures, Ai = f(T), Bi = f(T), Ci = f(T), Di = f(T).
- Repeat Steps 1-5 for other components (i).
- Calculate xi as a function of partial pressure of component (i) from Equation 5.
Then Equations 6 and 7 show the mole fraction conversion of components to volumetric dimensions.
The equation box shows the proposed equations for the solubility of acid gases in glycols in mole fraction. The pressure limits of applicability for CO2 solubility in TEG are 12,000 kPa partial pressure and temperature of 130° C.
Concerning H2S solubility in TEG, the pressure limits of applicability are 2,000 kPa and temperature of 100° C., and for CO2 solubility in DEG partial-pressure range is 10,000 kPa and temperature of 125° C. Concerning H2S solubility in DEG, the limits of applicability are 2,000 kPa pressure and 125° C. temperature.
Equations 6 and 7 show the mole fraction conversion of acid-gas components to volumetric dimensions.
Results
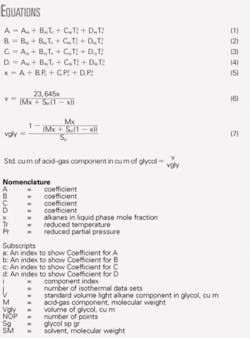
Fig. 1 shows the model’s results of absorbed H2S in TEG. It also shows the trend of solubility of H2S in TEG at different temperatures and partial pressures
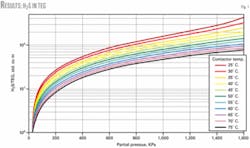
Fig. 2 illustrates the solubility of CO2 in TEG as a function of CO2 partial pressure at different temperatures; it also shows the solubility of CO2 in TEG is less than for H2S.
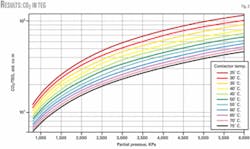
Fig. 3 shows the model’s results of absorbed H2S in DEG. It also shows the trend of solubility of H2S in DEG at different temperatures and partial pressures
Fig. 4 illustrates the solubility of CO2 in DEG as a function of CO2 partial pressure at different temperatures; it also shows the solubility of CO2 in DEG is less than for H2S.
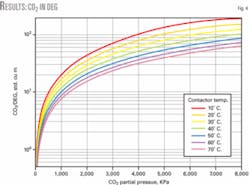
Table 1 compares experimental data for H2S of Reference 9 with results from the proposed model. As can be seen, the average absolute deviation percent at different temperatures and for H2S in DEG is 2.5139%, but for the Peng-Robinson equation of state the average absolute deviation percent at different temperatures and for H2S in DEG is 10.57%.
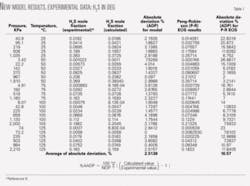
Table 1 also compares the proposed numerical model and Peng-Robinson equation of state results in predicting the solubility of H2S in DEG.
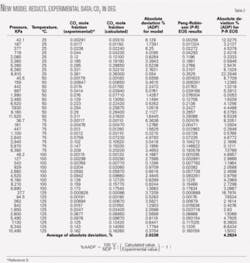
Table 2 compares the experimental data for CO2 of Reference 9 with results from the proposed model. As can be seen, the average absolute deviation percent at different temperatures and for CO2 in DEG is 2.034%, but for the Peng-Robinson equation of state, the average absolute deviation percent at different temperatures and for H2S in DEG is 4.2624%.
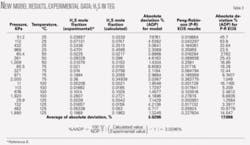
Table 3 compares experimental data for H2S of Reference 8 with results from the proposed model. As can be seen, the average absolute deviation percent at different temperatures and for H2S in TEG is 3.0296%, but for the Peng-Robinson equation of state the average absolute deviation percent at different temperatures and for H2S in TEG is 17.096%.
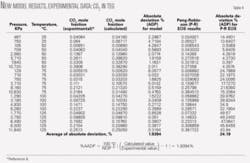
Table 4 compares the experimental data for CO2 of Reference 8 with results from the proposed model. The average absolute deviation percent at different temperatures and for CO2 in TEG is 1.9394%, but for the Peng-Robinson equation of state the average absolute deviation percent at different temperatures and for H2S in TEG is 24.19%.
Since dehydrators usually operate at temperatures less than 60° C., there was no practical need to include temperatures higher than 75° C. in graphs of this work.
References
- Bahadori, A., “Calculating light alkanes solubility in TEG,” Petroleum Technology Quarterly, Vol. 11 (2006), No.5, pp. 165-171.
- Jou, F.-Y., Otto, F.D., and Mather, A.E., “Solubility of Methane in Glycols at Elevated Pressures,” Canadian Journal of Chemical Engineering, Vol. 72 (February 1994), pp. 130-133.
- Grizzle, P.L., “Hydrocarbon Emission Estimates and Controls for Natural gas Glycol Dehydration Units,” SPE/EPA Exploration& Production Environmental Conference, Mar. 7-10, 1993.
- Bahadori, A., “Solubility of BTEX in TEG,” International Gas Engineering and Management, Vol. 46, September 2006, No. 7, pp. 15-17.
- Bahadori, A., and Zeidani, K., “New equations estimate acid-gas solubility in TEG,” OGJ, Feb. 27, 2006, p. 55.
- Bahadori, A., “Design of glycol unit for maximum efficiency in Gachsaran Oil Field,” SPE No. 81121, Latin American and Caribbean Petroleum Engineering Conference, Apr. 27-30, 2003, Port-of-Spain, Trinidad.
- Wichert, E., and Wichert, G.C., “New charts estimate acid gas solubility in TEG,” Hydrocarbon Processing, January 2004, pp. 47-48.
- Jou, F.-Y., Deshmukh, R.D., Otto, F.D., and Mather, A.E., “Vapor-Liquid Equilibria for Acid gases and Lower Alkanes in Triethylene Glycol,” Fluid Phase Equilibria, Vol. 36 (1987), pp. 121-140.
- Jou, F.-Y, Otto, F.D., and Mather, A.E., “Solubility of H2S and CO2 in diethylene glycol at elevated Pressures,” Fluid Phase Equilibria, Vol. 175 (2000), pp. 53-61.
The author

Alireza Bahadori ([email protected]) is a senior process engineer with the National Iranian South Oil Co., Ahwaz, Iran, and a part-time graduate researcher in chemical engineering at Razi University. Previously he was a lecturer at the University of Masjed-Soleiman, Iran. He holds a technical diploma in control instrument services from National Iranian Oil Co. technical school in Aghajari (1991). He also holds a BSc in chemical engineering from the Petroleum University of Technology, Iran (1998), and an MSc in chemical engineering from the University of Shiraz, Iran (2000). He is a member of the Iranian association of chemical engineers.