API: US oil industry broke several records in January
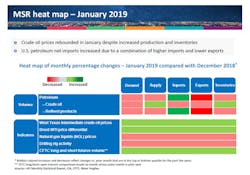
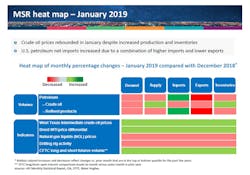
The US natural gas and oil industry broke several records in January, according to the latest Monthly Statistical Report from the American Petroleum Institute.
US total petroleum demand, as measured by total domestic petroleum deliveries, was 20.7 million b/d in January, which was down 0.2% from December but up 1.1% compared with January 2018. This was the strongest petroleum demand for January since 2005.
January’s gasoline demand of 8.9 million b/d was the strongest on record since 1945. Gasoline prices fell in January even as the crude oil price rose.
In January, distillate deliveries of 4.2 million b/d increased by 2.4% from December but decreased 3.3% vs. January 2018. The US Bureau of Labor Statistics’ Producer Price Index for freight trucking increased by 8% year over year in January as strong activity and a driver shortage that has resulted in trucker salaries at Amazon and Walmart rising to nearly $90,000/year, or roughly 40% above the median US household income.
In January, kerosene jet fuel deliveries of 1.6 million b/d decreased by 2.4% compared with December but were up by 1.4% vs. January 2018, which made for the strongest demand for January since 2007. The increase generally was consistent with the International Air Transport Association’s latest report, which showed US air passenger kilometers increased by 3.8% year over year in December.
Residual fuel oil demand was 297,000 b/d in January, a decrease of 17.3% from December and 12.6% vs. January 2018. This was due to fewer US average heating degree days in this January and decelerated marine shipping activity.
Oil supply
According to API data, US crude oil production of 11.9 million b/d in January—No. 1 in the world—marked the highest monthly output on record.
The increased production reflects the rise in drilling activity over the past quarter, which Baker Hughes reported an average of 878 oil-targeted rigs in fourth-quarter 2018, up from 863 rigs in third-quarter 2018. The rig count slipped to an average of 866 in January, however, so further production growth may hinge on the extent to which the backlog of drilled but uncompleted wells (DUC) begins to be drawn down. EIA reported nearly 8,600 DUCs as of yearend 2018.
Natural gas liquids production was 4.9 million b/d in January—the highest on record for any month.
Refining, trade
US refineries set new records for January with throughput of 17.3 million b/d and refinery capacity utilization of 93.1%.
US petroleum exports of crude oil and refined products decreased to 7.5 million b/d in January from 7.8 million b/d in December and 8 million b/d in both November and October of 2018.
The US petroleum net trade balance increased to 2.6 million b/d in January after having been below 2 million b/d in December. Although exports in January still represented an improvement of 1 million b/d lower net imports compared with January 2018, the fall in exports appears consistent with indications of slower global economic growth.
Despite the strong crude oil production and refining as well as demand, total US petroleum inventories are currently 5.8% above their historical 5-year average.
Within the January total, crude oil inventories rose 1.4% month over month, while refined product stocks fell 0.9% month over month.

