Regressions allow development of compressor cost estimation models
Zhenhua Rui
Paul A. Metz
Gang Chen
Xiyu Zhou
Xiaoqing Wang
University of Alaska
Fairbanks
Historical data and multiple nonlinear regressions allow the development of regional and national compressor station construction component cost estimation models, capable of estimating cost components with respect to both different compressor station capacities and regions.
Results show a large cost difference between regions and how economies of concentration play an important role in reducing unit cost. Results also indicate that all compressor station cost components have economies of scale with respect to compressor station capacity.
Limited literature is available on pipeline compressor station cost estimation.1 2 This article presents 10 regression models developed to estimate pipeline construction component costs for different compressor station capacities in different regions, based on a data set of 220 compressor station costs. Researchers used the regression models developed to investigate cost differences in terms of region and compressor station capacity. Results show a large cost difference among different regions.
The unit cost of compressor station construction components has economies of scale regarding capacity.
The article also discusses the estimation models’ limitations.
Data
Compressor station selection is guided by data availability. The US Federal Energy Regulatory Commission collects compression station construction cost data from gas transmission companies each year, which are published in the Oil & Gas Journal’s annual data book.3
The compressor station data set includes year of completion, capacity, location, and individual cost components. Compressor stations in the data set were distributed in all states in the US (Alaska and Hawaii excluded). The compressor stations were completed between 1992 and 2008.
The data did not show the construction period within each year. The year of completion is defined by the time of filling the FERC report, which ranges from July 1 of the filings year to June 30 of the next year. For example, Year 1999 stands for projects filed as completed between July 1, 1999, and June 30, 2000.
This article defines capacity as the horsepower of the compressor station. Cost is real, accounted costs determined at the time of completion. All pipeline compressor station construction cost components are in US dollars. The entire data set has 220 observations of compressor station projects.
The five cost components are material, labor, miscellaneous, land, and total costs. Miscellaneous cost is a composite of the costs of surveying, engineering, supervision, interest, administration and overheads, contingencies, telecommunications equipment, freight, taxes, allowances for funds used during construction, and regulatory filing fees. The total cost is the sum of material cost, labor cost, miscellaneous cost, and land cost.3 This article used the Chemical Engineering Plant Cost Index—a widely used index for adjusting process plants’ construction cost—to adjust all costs to 2008 dollars.4
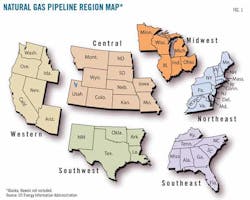
Data describing the location of US pipeline systems were in state format, with 48 states referred to and Alaska and Hawaii excluded. The US Energy Information Administration breaks down the US natural gas pipelines network into six regions: Northeast, Southeast, Midwest, Southwest, Central, and Western.5 Fig. 1 shows the different regions. Researchers used these regional definitions to analyze geographic differences in the compressor station data.
Displaying 1/5 Page1, 2, 3, 4,5Next>
View Article as Single page

