Regressions allow development of compressor cost estimation models

Zhenhua Rui
Paul A. Metz
Gang Chen
Xiyu Zhou
Xiaoqing Wang
University of Alaska
Fairbanks
Historical data and multiple nonlinear regressions allow the development of regional and national compressor station construction component cost estimation models, capable of estimating cost components with respect to both different compressor station capacities and regions.
Results show a large cost difference between regions and how economies of concentration play an important role in reducing unit cost. Results also indicate that all compressor station cost components have economies of scale with respect to compressor station capacity.
Limited literature is available on pipeline compressor station cost estimation.1 2 This article presents 10 regression models developed to estimate pipeline construction component costs for different compressor station capacities in different regions, based on a data set of 220 compressor station costs. Researchers used the regression models developed to investigate cost differences in terms of region and compressor station capacity. Results show a large cost difference among different regions.
The unit cost of compressor station construction components has economies of scale regarding capacity.
The article also discusses the estimation models’ limitations.
Data
Compressor station selection is guided by data availability. The US Federal Energy Regulatory Commission collects compression station construction cost data from gas transmission companies each year, which are published in the Oil & Gas Journal’s annual data book.3
The compressor station data set includes year of completion, capacity, location, and individual cost components. Compressor stations in the data set were distributed in all states in the US (Alaska and Hawaii excluded). The compressor stations were completed between 1992 and 2008.
The data did not show the construction period within each year. The year of completion is defined by the time of filling the FERC report, which ranges from July 1 of the filings year to June 30 of the next year. For example, Year 1999 stands for projects filed as completed between July 1, 1999, and June 30, 2000.
This article defines capacity as the horsepower of the compressor station. Cost is real, accounted costs determined at the time of completion. All pipeline compressor station construction cost components are in US dollars. The entire data set has 220 observations of compressor station projects.
The five cost components are material, labor, miscellaneous, land, and total costs. Miscellaneous cost is a composite of the costs of surveying, engineering, supervision, interest, administration and overheads, contingencies, telecommunications equipment, freight, taxes, allowances for funds used during construction, and regulatory filing fees. The total cost is the sum of material cost, labor cost, miscellaneous cost, and land cost.3 This article used the Chemical Engineering Plant Cost Index—a widely used index for adjusting process plants’ construction cost—to adjust all costs to 2008 dollars.4
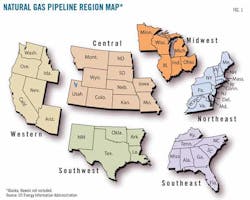
Data describing the location of US pipeline systems were in state format, with 48 states referred to and Alaska and Hawaii excluded. The US Energy Information Administration breaks down the US natural gas pipelines network into six regions: Northeast, Southeast, Midwest, Southwest, Central, and Western.5 Fig. 1 shows the different regions. Researchers used these regional definitions to analyze geographic differences in the compressor station data.
Cost estimation
The data set collected in this study has information on compressor station capacity and location as well as individual cost components. Researchers studied the multiple nonlinear regression methods used to assess pipeline cost data (OGJ, July 4, 2011, p. 22).6 This study, after trying different regression models, used the general form of multiple nonlinear regression model shown in Equation 1.
The Central region is the cost estimation base case. S denotes compressor station capacity, αi is the coefficient of variables (i = 0,…6). Positive αi of regional variables shows the region has a higher cost than the Central region cost, while negative αi (i = 0, …5) of regional variables shows the region has a lower cost than the Central regional cost.
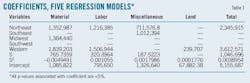
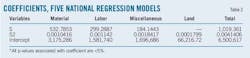
Researchers used this approach and available data to develop five cost estimation models. Table 1 shows coefficients of the regression models. National regression models developed for five individual cost components assigned the coefficient of regional variables as 0. Table 2 shows the coefficient of the regression models.
The corrgram test examines residual autocorrelation.7 Table 3 shows the maximum value of autocorrelation from Lag 1 to Lag 40. Autocorrelation lies between –0.17 and 0.22. Results show errors associated with observations as statistically independent from one another.
Researchers used an F test and its associated p-value to test the overall model for predictive capability. The name of the ratio of the square mean of the square for regression and the mean square for error is F-statistics.9 Normally a large F-value suggests the model explains a large proportion of variance. The p-value associated with the F-statistic is significant when the p-value is less than 5%.
F-statistics of all five models are very large and associated p-values are less than 1%, leading to the conclusion that at least one of the model’s parameters has predictive capability. All p-values of coefficients measuring well below 5% allows the conclusion that parameters in all 10 models are significant.
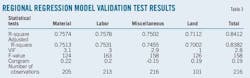
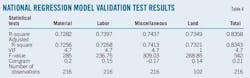
R-square and adjusted R-square help determine the model’s goodness of fit. R-square shows the independent variables explaining the proportion of variance in the dependent variables. One disadvantage of R-square is that its value can be artificially inflated by putting in additional independent variables.10 Adjusted R-square, therefore, usually accompanies R-square when determining fit.
The values of R-square for all models are greater than 0.71, and the adjusted R-square values are almost the same as the R-square values in all models, showing that a large proportion of variability in the model can be explained by the independent variables and that these regression models are good models.
Various diagnostics and tests, therefore, validate these 10 regression models. The following section uses these regression models to analyze cost differences in regions and compressor station capacities.
Regional differences
Regional coefficients show that all differences in compressor station construction cost components are related to station location (Table 1). The material cost model’s coefficients show material costs in the Northeast, Midwest, and Western regions related and much higher than that in the Central region. The Western region has the highest material cost among these four regions.
The labor cost model shows a relationship between the Northeast and Midwest regions and that the labor costs in these two regions are higher than those in the Central region. The Western region shows the highest labor cost.
The miscellaneous cost model displays a relationship to the Northeast, Southeast, and Central regions, with all coefficients positive. The Northeast region has the highest miscellaneous cost among these three regions.
The land cost shows a relationship to the Western and Central regions, and the coefficient of the Western region is positive.
Total cost models show relationships to the Northeast, Western, and Central regions, and all coefficients are positive. The Western regions have the highest costs in these three regions.
The Southwest region is the only region that doesn’t show a relationship to any component cost. Other regions show a relationship to at least two component costs. The Central region appears to have the lowest cost for all construction components combined.
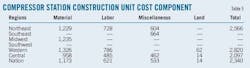
Table 5 provides unit costs of construction components for a 5,000-hp compressor station in different regions with cost estimation models.
Unit total costs of compressor stations in different locations show a noticeable difference. The unit total cost in the Central region is $2,097/hp, but unit total cost in the Western region is $2,820/hp. Compressor station unit total costs in the Western region are 34% higher than in the Northeast region and 20% higher than the national average. Unit land cost in the Western region is more than three times higher than unit land cost in the Central region and in the whole nation. The unit total cost difference for compressor station construction component costs caused by geography can reach more than 34%. Therefore, the geographical factor is critical in determining the compressor station construction cost.
The values of the coefficient of the Western and Northeast regions show the Northeast’s cost of living as slightly higher than the West. The Western region, however, has a higher cost in material, labor, land, and total cost than the Northeast region.
This comparison shows economies of concentration plays as playing an important role in compressor station construction cost. Economies of concentration are a type of economy of scale, also called external economies. Economies of scale tend to arise when firms or projects in the same industry are located close together.11
About 28% of US compressor stations are in the Northeast region, with 50.8% of these concentrated in Pennsylvania, while only 13.3% of US compressor stations are in the Western regions. The fact that a large number of compressor stations were built in the Northeast region and in Pennsylvania reduces unit cost of compressor station construction.
Major factors for cost differences in different regions include:
• Cost differences between regions, such as material and land costs.
• Geographic factors, such as terrain and population density.6
Weather conditions, soil properties, cost of living, and distance from supplies are also variables for cost differences between regions.12 Whether the compressor station is a Greenfield project also helps determine costs.13 Economies of concentration are also an important factor for determining cost differences in different regions. It is impossible, however, to conduct quantitative analysis of cost difference in different locations without detailed information.
Capacity differences
Coefficient results show cost is also related to compressor station size. All costs show a relationship to both compressor station capacity and compressor station capacity square (sq hp) except land cost, which only shows relationship to compressor station capacity square.
Figs. 2-7 show the trend of compressor station construction cost components as related to compressor station capacity in different regions.

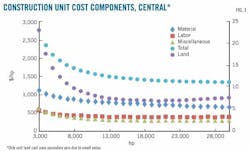
Fig. 2 illustrates compressor station unit total cost in the US decreasing as compressor station capacity increases. This trend suggests the total cost has economies of scale with respect to compressor station size. For example, the unit total cost of a 2,000-hp compressor station is 3.2 times that of 30,000-hp compressor station. A similar trend exists in unit costs of material, labor, miscellaneous, and land.
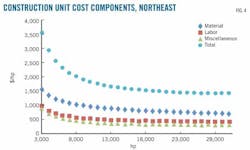

Figs. 2-7 show the estimated unit cost trend of cost components in the Central, Northeast, Southeast, Midwest, and Western regions. All individual component unit costs decrease with increasing compressor station capacities in different regions. Analysis concludes all cost components as having economies of scale with regard to compressor station capacity in all regions.


Economies of scale caused by growth of the project itself are called internal economies of scale. Increasing compressor station size can produce internal economies of scale for compressor station projects. Technical economies, managerial economies, marketing economies, and financial economies are considered four major categories of internal economies of scale.11
Specialized equipment or processes improve labor and capital productivity in large pipeline projects. For example, large and efficient trenchers and trucks increase productivity and reduce the cost of diesel. Small compressor station projects cannot afford heavy equipment costs because they cannot diffuse the high fixed cost. Large equipment and facilities are also easily operated in high capacity with less idle capacity.
Managerial economies of scale have large compressor station projects hiring more professional and specialized managers to perform specialized tasks with skill and productivity instead of hiring one manager in charge of everything. Marketing economies can realize a large discount by purchasing a large amount of compressor station promotional material. Large compressor station projects being more likely to be awarded low interest rate loans or government subsidies is an examples of financial economies of scale.
These factors support the idea that large compressor station projects have economies of scale and low unit cost and match regression results showing unit costs of compressor station construction components falling with increasing compressor station size.
Limitations, suggestion
Data used in this article included a large number of compressor stations built between 1992 and 2008. But some regions, such as the Midwest, still have relatively few pipelines. Among all compressor stations, 57% have capacities less than 8,000 hp, and only 2.73% are more than 40,000 hp.1 Uneven distribution and a limited number of compressor stations with large capacities may cause estimation biases.
An unknown starting year and unknown construction period cause a biased cost by adjusting along with the chemical plant index. US natural gas pipelines’ region definitions are based on federal regions of the US Bureau of Labor Statistics. Other region definitions, however, may be better for the distribution of US compressor stations.
The lack of some variables that produce cost differences, such as types of compressors and terrain, prevents conducting certain quantitative analyses. Missing data also include type of compressor station ownership: private or public.
Future work should collect more observations with more detailed information on the missing variables to improve the effectiveness of the cost estimation models.
References
1. Rui, Z., Metz, A.P., Chen, G., Zhou, X., and Wang, X., "US Pipeline Compressor Station Cost Analysis," internal report, University of Alaska Fairbanks, 2011.
2. IEA Greenhouse Gas R&D Programme, "Transmission of CO2 and Energy," Report No. PH4/6, 2002.
3. Oil & Gas Journal Databook, Tulsa: PennWell Corp., 1992-2010.
4. Chemical Engineering, Plant Cost Index, http://www.che.com/pci, accessed July 2010.
5. Energy Information Administration, http://www.eia.doe.gov, accessed July 2010.
6. McCoy, S.T., and Rubin, E.S., "An Engineering-Economic Model of Pipeline Transport of CO2 with Application to Carbon Capture and Storage," International Journal of Greenhouse Gas Control, Vol. 2, No. 2, pp. 219-29, 2008.
7. UCLA, "Regression with Stata," http://www.ats.ucla.edu/stat/stata/webbooks/reg/chapter2/statareg2.htm, accessed July 2010.
8. Rui, Z., Metz, A.P., Reynolds, B.D., and Chen, G., "An Analysis of Inaccuracy in Pipeline Construction Cost Estimation," International Journal of Oil, Gas and Coal Technology, Vo. 5, No. 1, pp. 29-46, 2012.
9. Markridakis, S.G., Wheelright, S.C., and McGee, V., "Forecasting, Methods and Applications," New York: Wiley, 1983.
10. Neter, J., Kutner, M., and Nachtsheim, C., "Applied Linear Statistical Models," New York: McGraw-Hill, 1996.
11. Wilkinson, N., "Managerial Economics: A Problem-solving Approach," Cambridge University Press, 2005.
12. Bordat, C., McCullouch, B., Sinha, K., and Labi, S., "An Analysis of Cost Overruns and Time Delays of INDOT Projects," Joint Transportation Research Program, Paper No. 11, 2004.
13. Interstate Natural Gas Association of America (INGAA), "Interstate Natural Gas Pipeline Efficiency," 2010.
The authors


More Oil & Gas Journal Current Issue Articles
More Oil & Gas Journal Archives Issue Articles
View Oil and Gas Articles on PennEnergy.com