P. 6 ~ Continued - World peak oil production still years away
View Article as Single page
US gas supply
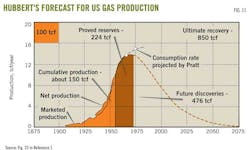
US gas supply trends have much relevance to world oil supply behavior. In his 1956 paper1 Hubbert forecast US natural gas production (Fig. 11) peaking around 1972 at about 14 tcf/year (38 bcfd) with a Qmax of 850 tcf.
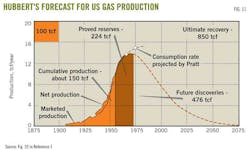
His figure also showed projected gas consumption rate that continued to increase after gas production peaked. Pratt supplied this projection.
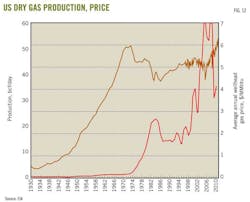
Fig. 12 shows that actual US dry gas production had a peak in 1973 almost the same as Hubbert forecast but at a higher peak rate of 60 bcfd.
Gas consumption continued to increase after the peak as his plot showed and the shortfall that occurred after 1973 was met by imports, mostly by pipeline from Canada.
Fig. 12 shows annual gas production until 1997 and monthly production after 1997. The decline in production after the 1973 peak, however, did not happen according to Hubbert's forecast. The rate began to decline for 2 years and then remained constant for 5 years. The decline then resumed, finally bottoming out at 44 bcfd in 1986.
Since then, production has increased steadily and more sharply in 2006. Production today is about 63 bcfd of dry gas, or more than the 1973 peak.
If the production decline had mirrored the front side of the peak, in 2010 we would expect a gas production of about 6 bcfd, the same as in 1936.
The Hubbert method failed to forecast what has happened on the back side of the US gas production curve. The reason is economics. Once US gas supply peaked and a gas shortage developed, the gas price began to increase. The increased price shook loose gas that previously was uneconomic to produce and the industry began to develop technologies to find and produce coalbed methane, tight gas, and shale gas. This unconventional gas now accounts for the majority of current US gas supply.
The US surpassed Hubbert's estimate of the total ultimate recovery of 850 tcf in 1997 and so far has produced more than 1,120 tcf without reaching a new peak.
Fig. 12 also illustrates the effect of price on supply. The steep run up in the gas price after the peak created new supplies, causing the Hubbert model to fail on the back side.
The same thing did not happen for US oil supply because the oil market is a global market. The price of US oil could not be pushed up in the same way that gas price was pushed up because the US always has imported a large portion of its oil. US oil producers were constrained by world oil price, which remained relatively low until recently.
In contrast, apart from Canadian supplies and a small and expensive LNG market, the US gas market is relatively insular.
This analogy between oil and gas illustrates that economics affect the supply of commodities such as oil and gas. In the case of world oil supply, the oil price has increased recently before reaching peak oil production. This in turn has delayed the peak and increased total cumulative production.
When world oil production eventually does peak, as it must, the back side of the curve will not mirror the front side as Hubbert had forecast. It probably will not look like the back side of the US gas supply curve either. Economics and technology will control the curve, which at this time is difficult to predict.
In his 2010 book,5 Deffeyes presents several proofs and analogies to show that the production curves must be symmetrical and that its back side must mirror its front side. All these proofs depend on a constant oil price, which clearly will not happen.
If and when oil production does peak, the shortage of supply will push oil price up and the back side will not mirror the front side. The fact that the US gas production curve is asymmetrical is an indication of the fallacy of Hubbert's assumption and the subsequent proofs by Deffeyes
One scenario in which the back side of the curve might mirror the front side is if $100/bbl gas-to-liquids and coal-to-liquids technologies becomes economic. If the world shifted rapidly to these technologies and supply were maintained at a high enough rate to keep oil price constant, then the back side of the production curve might mirror the front side.
Displaying 6/7
View Article as Single page