P. 2 ~ Continued - World peak oil production still years away

View Article as Single page
Hubbert's model
For his forecasts, Hubbert asked Wallace Pratt and Lewis Weeks, both from ExxonMobil subsidiaries, to provide estimates of the ultimate recovery of oil and gas in the world and US.
But determining the ultimate reserves to be discovered and produced in the future was somewhat of a guessing game that Hubbert was not comfortable with. He then realized that with the right model, he did not need to guess. The production data itself could be fitted to the model to determine ultimate reserves.
From this model, he developed some mathematical methods for forecasting ultimate reserves. These methods depend on his assumed model for production, and the exact equations for the bell-shapped curve. This technique removed some uncertainty about ultimate reserves.
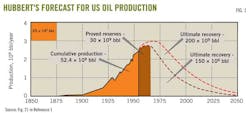
Three of Hubbert's bell-shaped curves show his forecast for oil production in the US (Figs. 1-3).1 He used two estimates from Pratt and Weeks for ultimate oil reserves of 150 billion and 200 billion bbl. With the higher estimate, he forecast that US oil production would peak in 1970 at 3 billion/year (8.2 million b/d).
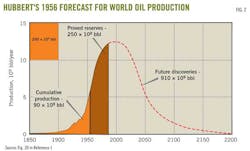
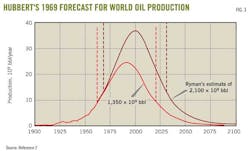
Fig. 3 shows that actual US oil rate peaked in November 1970 at 10 million b/d). In 1970, the US actually produced 3.5 billion bbl.
Hubbert's prediction was remarkably successful and this has given much credence to his method that came to be known as peak oil theory or Hubbert's peak.
The plot in Fig. 2 does have two deviations. After the November 1970 peak, US oil production declined for 6 years in the manner predicted by Hubbert. But from January 1977 to February 1986, oil production rose again forming a secondary peak at 9.14 million b/d.
This deviation and secondary peak was due to oil production from Prudhoe Bay and Kuparuk fields on Alaska's north slope. Hubbert might argue that he did not take this area into consideration and that, excluding the Alaska oil production, the US oil production from 1970 did decline in the manner predicted.
The other deviation is the incline since 2008 that was caused by the ramping up of oil production from the deepwater Gulf of Mexico and from the unconventional Bakken oil play in North Dakota.
These oil sources, if allowed to continue, likely will cause US oil production to keep increasing to form a tertiary peak sometime after 2020. Once again, Hubbert might argue that he was talking about conventional onshore oil and did not consider these unconventional plays.
Despite these two deviations, Hubbert's predictions for US oil production were remarkably accurate.
Hubbert also forecast world oil production (Fig. 3), based on ultimate oil reserves of 1.25 trillion bbl. His forecast peaked at 12.5 billion bbl/year (34.25 million b/d) in 2000. Later in his 1969 paper, he revised his estimate with two ultimate recoveries of 1.35 trillion bbl and 2.1 trillion bbl.2 The more optimistic 2.1 trillion bbl estimate again peaked in 2000 at 37.5 billion bbl/year (103 million b/d).
Hubbert's forecasts obviously depend on knowing how much oil can be discovered and produced, and critics of his method say that this number is only a guess. Can we really know how much oil is going to be eventually discovered and produced in the world?
Displaying 2/7
View Article as Single page