P. 3 ~ Continued - World peak oil production still years away
View Article as Single page
Supporters point out that the timing of the peak is not sensitive to the actual assumed ultimate recovery. Indeed, from Figs. 3 and 5 three ultimate recoveries, ranging from 1.25 trillion to 2.1 trillion bbl, have a peak around 2000. Hubbert tackled this problem and, borrowing from the mathematics of biological population growth and decay, he devised a mathematical method for forecasting ultimate recovery, designated here as Qmax.
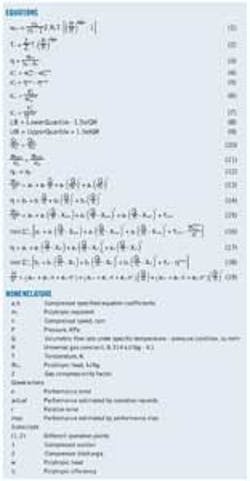
The equations he used start with Equation 1 in the equation box for the cumulative production Qt at time t. The production rate Qt at time t is the derivative of Qt with respect to t (Equation 2). Equation 2 is the basis for the production plots in Figs. 1-4.
If this model is correct for the production data then, as long as we have early time data, we can fit the data to the model and determine the ultimate recovery Qmax, as well as the parameters a and b.
Several methods will determine the parameters from the data. Hubbert recommended the combining of Equations 1 and 2 to give Equation 3. Equation 3 when rearranged gives Equation 4.
Equation 4 says in a plot of qt/Qt vs. Qt, parameter b is the intercept on the y axis and ultimate recoverable oil Qmax is the intercept on the x axis. This plot can be drawn at any time, even before the peak rate.
Taking the derivative of Equation 2 and setting it equal to zero finds the timing of the peak (Equation 5).
Equation 5 requires parameter a, which was not determined from the plot of Equation 4. The easiest way to determine parameter a is to rearrange Equation 1 as Equation 6.
Equation 6 says the slope of (Qmax/Qt)–1 vs. e–bt equals a. This second plot assumes that b and Qmax were determined from a plot of Equation 4.
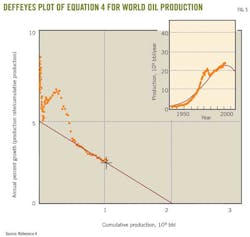
Deffeyes plotted Equation 4, using world production data until 2005 (Fig. 5). His extrapolation to the x axis shows a Qmax of 2 trillion bbl. Note that, before 1983, the data were increasing and deceasing and had not formed a straight line. But from 1983 to 2005, the data lie on a straight line as Hubbert's theory predicts.
Deffeyes also estimated the time of the peak rate directly from his plot because if the ultimate recovery is 2 trillion bbl then the peak oil rate will occur when cumulative production is 1 trillion bbl. This occurred in 2005 and led Deffeyes to predict 2005 as the year of peak production.
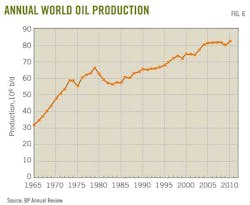
But world oil production did not peak in 2000 or in 2005. Fig 6 shows annual world oil production still was increasing in 2005
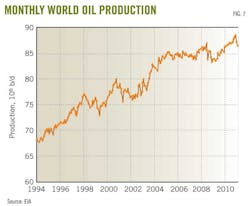
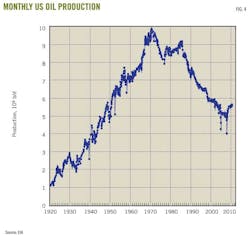
Fig. 7 shows the world's monthly oil production. Although production occasionally declines, the overall trend on both Figs. 6 and 7 is up and shows no evidence of a peak.
The occasional dips in production during the past 45 years are due to demand decreases rather than supply decreases. This, however, does not stop pundits from declaring that world oil production has peaked every time production decreases from 1 year to the next or even from 1 month to the next.
Data for Fig 6 are from the BP Annual Statistical Review, while the data for Fig. 7 are from the US Energy Information Agency (EIA). Any discrepancies between the two plots are due to the two different data sources. What is important is that both plots show a consistent upward trend in world oil production.
Production did have a secondary peak in 1979 and declined 1979-83. This was caused by a steep increase in world oil price that resulted in decreased demand as people reduced their use of transportation fuels.
But from 1983 to the present, oil demand has increased steadily and been matched by supply.
Displaying 3/7
View Article as Single page