Improve your refining process and save millions with predictive SPC
The oil and gas industry involves capital intensive processes with continuous output. Raw materials, such as crude oil, are converted to petroleum products on a very large-scale, making process control critical. The raw materials tend to have a large amount of variability in chemical and physical properties that can have a marked effect on the process output. Engineers tend to utilize scientific principles and experience to determine the process settings that are likely to produce desired results; however, such practices can be hit and miss. Statistical process control charts (SPC) are very useful to signal a process that becomes unstable. The downside of using SPC to alert a process shift is that suspect product is produced in the meantime.
Manufacturers transfer much of the responsibility of qualifying raw materials to suppliers. It is common for certifications to be sent to customers before materials are received, which is usually days or weeks before the material is used. What if the supplier information could be used to predict process shifts before process execution to allow for mitigation measures? This paper explains how the operational deployment of a process model can be used to create pre statistical process charts for this purpose. There are many other industries with processes that involve capital intense equipment, continuous flow, and incoming raw materials that include significant variation. The manufacturing of food, nutritional supplements, and chemicals are some of the example industries who can benefit from utilizing predictive spc.
Modeling techniques have become very powerful and easy to use with recent developments added to Minitab. Many organizations use process models for development and improvement. A process model is created from the supplier measure and process inputs (controlled by technicians) to determine the relationship to a key output. Engineers find the right number of inputs and model type needed to have a good fit for making reasonable predictions of the output. The model is deployed in ModelOps and connected to the flow of new data to make predictions. An SPC chart is created from the model predictions and monitored for stability. If an unfavorable trend is identified, the model is reviewed to find process variables that could be manipulated to mitigate the trend. All this work is done prior to execution of the process, which can be highly effective for minimizing quality risks.
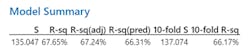
The example involves 16 continuous variables, one of which is a measure that is provided by a supplier certification sent prior to shipment of a raw material. There are discrete variables including the unit used for processing, and two major settings. A linear multiple regression model with good fit (r-square ~ 67%) is created from 478 rows of historical processing data utilizing stepwise variable selection (table A).
The response optimizer plot illustrates the leverage of the most important predictor variables. The supplier certification measure and initial pressure have steep, linear relationships as minor changes of value create noticeable differences in the key response. The cooling temperature indicates a lesser response and the changes in unit look to have grouped influence on the key response.
The regression model is doing a good job of predicting key response results for the historical data. Engineers easily publish the model to ModelOps from Minitab Statistical Software with one click.
New data is collected so predictions of the key output can be made. The data includes the measure from the supplier certification, static input values for settings, and distribution generated data for process variables with known variation. Processing temperatures are an example of distribution generated variables. Engineers know that the actual temperature at the point of process will vary about the control setting. Parameters for the variables are created from point of process measurements or technical specifications from the equipment manufacturer. The variables are calculated from a chosen distribution to get a realistic processing scenario. This is basically the same techniques used in Monte Carlo simulations.
Minitab Connect easily retrieves the data hourly and sends to Model Ops to get predictions. An individual and moving range control chart is utilized to monitor trends. It is very important to ensure that historical parameters are used to calculate the statistical control limits; using the simulated data to calculate limits is not appropriate. The predictive spc chart shown in figure 2 illustrates an expected stable process until the last 3 observations. All three of the end observations dipped below the historical lower control limit, which could create quality issues if the unstable trend continues.
Figure 2
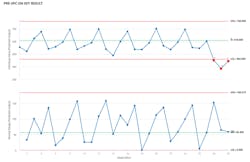
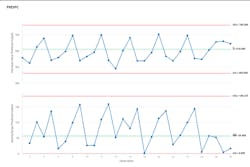
The engineering team reviews the process model and determines that the initial pressure is easily increased from the setting of 90 to 120. The model optimizer indicates that the change in the control setting will likely mitigate the dip in results due to the change in the supplier certification measure. The proposed change in the initial pressure setting is completed in the source data table and the data pull and charting in Connect is re-initiated. The resulting chart (figure 3) indeed provides information that the change in initial pressure mitigated the negative effects of the supplier measure change.
Figure 3
The concept of SPC involves timely reactions to shifting trends that result in instability. An unstable process involves quality risk, which can result in non-conforming or downgraded material. The ability to create process control charts on data before the process is executed is incredibly valuable as it is now possible to mitigate unfavorable trends before any actual results are created. In the oil and gas industry, the benefits can be in the millions of dollars due to the volume and potential revenue of products produced. Minitab solutions easily make the process of creating and monitoring predictive SPC an essential part of quality management.
To learn more, visit us at Minitab.com.