Oil market aims to fill the supply gap amid strong demand
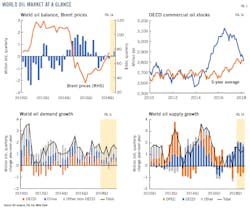
The Organization of Petroleum Exporting Countries’ output cutbacks amid strong global oil demand growth have managed to eliminate the surplus of the Organization for Economic Cooperation and Development’s stocks. As of April, OECD commercial stocks had fallen in 8 of the previous 9 months, reaching a 3-year low and a 5-year average, according to data from the International Energy Agency.
The year-to-date monthly average Brent spot price stands at $70/bbl, about 32% higher than the previous year. Brent prices averaged $77/bbl in May, the highest monthly average since November 2014. West Texas Intermediate also is hovering around $70/bbl.
Despite the rise of some downside risks, the near-term economic outlook remains supportive for oil demand growth, which also is supported by rising demand for petrochemical feedstocks. Notwithstanding, higher oil prices, currency depreciations against the US dollar in some countries and further substitution toward natural gas, will negatively impact oil demand growth.
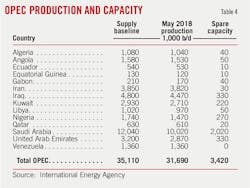
Reported OPEC compliance in May averaged 157% vs 94% in 2017, as involuntary cuts have boosted compliance. Venezuelan output has fallen hard since 2016. As production gains in Libya and Nigeria near maximum or constrained, the continuation of the Venezuelan output declines is felt strongly by the market balance and prices. According to IEA’s estimate, by yearend, the Venezuelan output could fall below 1 million b/d. On top of the accelerating decline in Venezuela output, Iranian sanctions introduce an additional element of uncertainty to OPEC output.
To compensate the considerable supply loss from Venezuela and potentially Iran, OPEC ministers announced a deal on June 22 that will increase oil supplies. Middle East OPEC countries, led by Saudi Arabia, could increase production in fairly short order by about 1.1 million b/d. However, existing spare capacity is limited and will shrink.
Non-OPEC production continues to expand in 2018 and in 2019, supported by a favorable commodity backdrop. The US still dominates gains, but the rate of growth is expected to slow. As the Permian basin’s crude production has continuously surprised to the upside, limited takeaway capacity and infrastructure constraints have resulted in a wider WTI mainland discount and may curtail production growth in the near to medium term. The infrastructure constraints will stay till second-half 2019.
Outside the US, Brazil, Canada, and the UK are sources of output growth. Russia also is ready to raise output rapidly. North Sea and Mexico outputs are declining. In general, international non-OPEC production still faces the challenge of steep declines in producing fields and the substantial drop off in long-cycle, major projects after 2019.
Overall, the market will be finely balanced and relatively tight for the remainder of 2018 and most of next year. In light of a deteriorating geopolitical environment amid falling stocks and low spare capacity, supply disruptions are expected to have a much bigger impact on oil price movements.
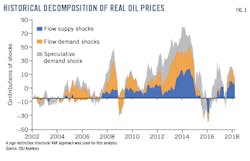
Forecasts based on a VAR model suggest that oil prices will stay high and relatively narrowly ranged before mid-2019.
World oil demand
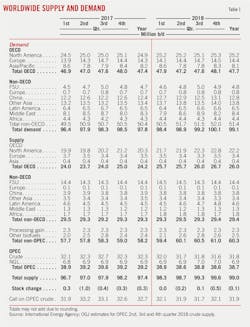
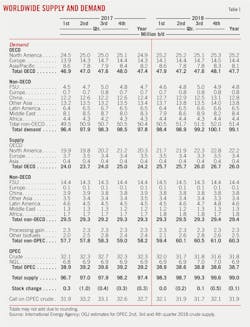
Strong global oil demand growth will persist through this year and into next year. Oil demand is now estimated to increase by 1.4 million b/d in both 2018 in 2019, according to IEA’s latest forecast. This is a deceleration from the 2017 growth of 1.6 million b/d. Worldwide demand for oil will increase to 99.1 million b/d in 2018 and 100.6 million b/d in 2019 compared with 97.8 million b/d in 2017.
Specifically, colder than normal winter weather in the US and Europe, new petrochemical facilities in the US, and strong economic growth supported oil demand growth early this year.
Global economic growth was 3.1% in 2017 and is expected to be 3.1% in 2018 and 3% in 2019, according to the Global Economic Projects report recently published by the World Bank. This compares with 2.4% in 2016 and 2.8% in 2015. However, downside risks are building, including rising trade tensions, some tightening of global financing conditions due to less expansionary monetary policy in developed economies, higher debt levels worldwide, and political uncertainties.
Demand for petrochemical feedstocks, such as ethane, propane, and naphtha, accounts for a large part of oil demand growth. There will be nine petrochemical projects, including the expansion of existing sites, to come on stream in 2018 and 11 more in 2019. The US and China represent most of the global capacity additions. As highlighted in IEA’s Report Oil 2018—Analysis and Forecasts to 2023, the petrochemical industry will be a key factor driving oil demand growth for many years.
Meanwhile, as oil demand becomes increasingly price sensitive, higher oil prices will weigh on demand. Hence, oil demand growth will slow in this year’s second half compared with the first half.
In addition, depreciated currencies against the US dollar are threatening oil demand in some emerging markets and some OECD countries. In US dollars, Brent crude oil prices increased more than 60% since mid-2017. However, crude oil prices increased much more dramatically in Argentina peso, Brazilian real, Mexico peso, Indian rupees, Euro dollars, and Turkish lira over the same period. As many countries have removed subsidies in recent years, higher domestic costs of oil products can pass directly to consumers and impede consumption.
OECD demand is the most sensitive to oil price. Under the weight of higher oil prices and overall moderated economic growth, demand growth for OECD will slow from 500,000 b/d in 2017 to 310,000 b/d in 2018 and 245,000 b/d in 2019, IEA said.
By region, oil demand in OECD Europe this year will flatten out while demand in OECD Asia will decline from a year ago. OECD Europe oil demand growth will slow to 70,000 b/d in 2018 from 295,000 b/d in 2017, before posting a rebound in 2019. Japanese oil demand dropped by roughly 85,000 b/d in 2017. A decline of more than 100,000 b/d will continue this year and into next.
According to World Bank, OECD Europe economic growth is expected to moderate to 2.1% this year, after a 2.4% growth for 2017. In Japan, as fiscal support fades, economic growth is expected to weaken to 1% in 2018 and 0.8% in 2019, following 1.7% in 2017.
US oil demand continues to be strong, supported by solid economic growth and the commissions of new petrochemical projects. US economic growth is expected to reach 2.8% this year.
Non-OECD demand will expand at 1 million b/d this year and 1.2 million b/d next year, following a 1.2 million b/d growth in 2017, IEA said. The economic growth rate for emerging markets and developing economies is forecast to rise to 4.5% in 2018 and 4.7% in 2019 from 4.3% in 2017, according to the World Bank. Non-OECD demand has been consistently driven by structural trends of population growth, industrialization, and urbanization.
Chinese oil demand is estimated to have increased by 470,000 b/d over the first 4 months of this year compared with the same period last year. For 2018, Chinese oil demand growth is expected to slow to 410,000 b/d, down from 610,000 b/d in 2017, IEA said. China economic growth is expected to slow lightly to 6.5% in 2018 compared with 6.9% in 2017. India’s oil demand will increase 285,000 b/d this year and 215,000 b/d in 2019, following a growth of 125,000 b/d in 2017.
World oil supply
OPEC compliance hit a new record at 174% in April, and 158% in May. Nearly 2 million b/d of production now comes offline vs. the agreed cut of 1.2 million b/d. Involuntary decline from Venezuela and Angola and strong compliance of Saudi Arabia remain the primary driver of the record-high compliance.
Venezuela’s production continues to collapse, and the outlook is worsening due to mismanagement, chronic underinvestment, and corruption. In May, Venezuela’s output averaged 1.36 million b/d compared with 2.05 million b/d a year ago. This decline of nearly 700,000 b/d has almost completely offset robust Permian growth.
According to IEA’s latest estimate, Venezuela’s output could decline to 1 million b/d in this year’s third quarter, and below that mark by yearend. As for 2019, it is hard to see a recovery and output is likely to fall further by an additional 200,000 b/d or even more.
Saudi Arabia’s compliance has been consistently strong, totaling 128% in April and 108% in May, with 625,000 b/d and 520,000 b/d of production offline vs. the baseline level. Other GCC compliance has been strong as well.
Production from Libya and Nigeria will be volatile, but neither country can meaningfully increase production from current levels.
The US’s withdrawal from the Joint Comprehensive Plan of Action (JCPOA) in May and the renewal of all nuclear-related US sanctions on Iran would likely limit crude oil exports and production from the country by yearend.
Iran is currently producing 3.8 million b/d. This is up from the 2014-15 average of 2.8 million b/d. Iran has struggled to increase production beyond current levels. Iran’s crude oil exports this year have averaged 2.1 million b/d, with another 300,000 b/d of condensate exports. Prior to sanctions during 2010 and 2011, crude exports averaged 2.3 million b/d. During sanctions from 2012 to 2015, exports averaged just 1.1 million b/d.
Saudi Arabia, along with other producers, would intend to increase production to ensure the availability of adequate supplies to offset any potential shortfalls. According to the communique issued on June 22, OPEC countries “will strive to adhere to the overall conformity level of 100%” starting in July. Full compliance means an increase of 1 million b/d from current levels.
So, production should climb 1 million b/d above May levels over the next several months, with the bulk of it coming from Persian Gulf states. Noticeably, no noteworthy growth in OPEC capacity over this year and next is expected. According to an IEA analysis, from 2013 to 2017, the OPEC major project backlog averaged 1.2 million b/d/year. While there are several planned startups for 2018, beyond this year the project queue almost completely evaporates. Meantime, Venezuelan capacity is expected to sink by a further 200,000 b/d next year to only 790,000 b/d after plunging this year by 760,000 b/d.
In its latest Oil Market Report, IEA expected non-OPEC liquid fuels production to average 60.3 million b/d in 2018, 2 million b/d or 3.6% higher than the 2017 level. This was also higher than its forecast early this year, reflecting higher-than-expected US production.
The US oil output continues to impress with activity ramping up rapidly in the shale patch. The forecast for US crude oil production is rising to 10.7 million b/d for this year. However, pressure on midstream infrastructure and pipeline capacity out of the Permian and Eagle Ford basins in Texas is unlikely to be resolved before second-half 2019. The takeaway capacity limitations, along with other inflated costs, could curb in expansion in the short term.
Year-to-date, international non-OPEC production outside the US has underperformed expectations, largely because of declines in Brazil, Mexico, and the North Sea. IEA has already revised its international non-OPEC growth forecast lower by 200,000 b/d compared with its view entering this year.
Canada production continues to expand. Following an average increase of 360,000 b/d in output last year, Canadian oil output over the first 4 months of this year were 280,000 b/d higher than a year ago. Canada production is expected to continue to rise strongly in 2019, adding an estimated 180,000 b/d. Meantime, the discount of Western Canada Select to WTI blew out to more than $30/bbl earlier this year due to pipeline capacity constraints.
Brazil had a disappointing start in 2018, due to elevated maintenance, higher declines, and delayed contributions from major projects. However, Brazil is expected to account for the second-largest increase in non-OPEC oil output, as output from seven new production projects slated to start up this year, and another three in 2019.
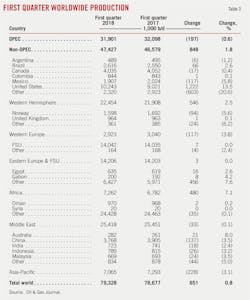
The North Sea has also underperformed year-to-date. In Norway, year-to-date production is down 115,000 b/d, with recent April data showing a 245,000 b/d year-on-year decline. The increases in the UK will only partly offset lower Norwegian output. North Sea oil production is set for a third consecutive annual decline in 2019 before supply recovers in 2020 once the giant Johan Sverdrup field ramps up.
In May, Russian crude supply held steady at 10.97 million b/d, 260,000 b/d lower than October 2016’s record level. Russian producers might choose to increase supplies after the recent June 22 meeting. According to government officials, Russia can raise its output back to preagreement levels within months. Kazakhstan’s output will increase due to the continuation of the Kashagan’s production ramp-up.
Chinese oil production has sharply declined since the start of 2016, from 4.2 million b/d in January 2016 to 3.8 million b/d in mid-2017. The declining trend was partly arrested since July 2017, thanks to a boost in upstream spending by China’s largest oil producers. Notwithstanding, Chinese crude oil production is expected to decline by roughly 100,000 b/d in both 2018 and 2019.
Since reaching a record high of almost 3.09 billion bbl at the end of July 2016, OECD commercial stocks have fallen by 280 million bbl to 2.81 billion bbl at the end of April, a new 3-year low. The US accounted for more than half of that decline, as US crude oil and other liquids inventories decreased by 179 million bbl over that period.
At the end of April, OECD stocks were 27 million bbl below the 5-year average, with crude and oil products both in deficit.
US economy, energy consumption
US economic growth continues to be robust. Procyclical fiscal stimulus, including the drop in business regulations and the dramatic corporate tax rate cut to 21% from 35%, account for the most positive outlook. OGJ forecasts that US gross domestic product will grow 2.8% this year.
Led by manufacturing, industrial production hit an all-time high in April. The Institute for Supply Management’s (ISM) Purchasing Managers Index (PMI) registered 58.7 in May, an increase of 1.4% from April. The ISM indices and consumer confidence remain at historically high levels. Consumer spending is accelerating, in response to increased disposable incomes provide by personal income tax cuts and a tightening labor market.
The employment data from the US Bureau of Labor Statistics showed that US nonfarm payrolls grew 223,000 in May and the unemployment rate fell to 3.8%. With the unemployment rate hitting a record low, the economy is near its production potential level. Wages are increasing, albeit a little tepid. Inflation is rising at a moderate pace.
The Federal Open Market Committee raised the current fed funds rate to 2% in June 2018. It expects to increase this interest rate to 2.4% in 2018, 2.9% in 2019, and 3.4% in 2020.
Recent trade policy changes are not expected to have a substantial effect on US growth, according to the World Bank.
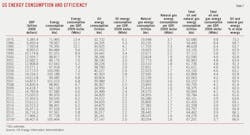
US energy demand will rise to 100.46 quadrillion btu (quads) this year, OGJ forecasts. Fossil fuels continue to account for the bulk of US energy consumption. Crude oil remains the dominant energy source, holding 37% of the market. The share of crude oil energy consumption in total energy consumption has increased in each of the past 4 years. Natural gas claims 30% of the energy mix, up from 24% in 2008.
US oil demand
Overall, in line with solid economic growth, most of the major indicators relating to transportation, industry, and construction saw a positive trend providing support to US oil product demand.
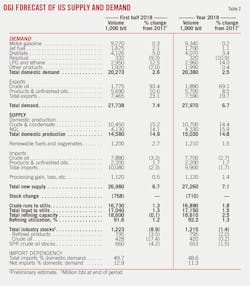
Motor gasoline demand so far became the highest on record since 1945, on the back of increased vehicle miles traveled, partly offset by higher prices and the continuing improvements in vehicle fleet efficiency. According to monthly statistics from the American Petroleum Institute, year-to-date through May, motor gasoline demand reached 9.2 million b/d. This was an increase of 0.4% compared with the same period in 2017.
Demand for distillate fuel oil was up 5.2% year-over-year through the first 5 months of the year, according to API data. About 96% of distillate demand was for ultra-low sulfur distillate. The growth suggested rising industrial production, increased road freight transportation, and increased drilling and completion activity in the oil and gas sector. The truck transportation of freight indicator, an estimator of trucking activities by the BLS, soared 10% over the first half of this year compared with first-half 2017.
Kerosene jet fuel demand had been surprisingly strong in 2017, up 3.2% over a year ago. In 2018, jet fuel demand growth continued to accelerate, reaching a strongest May ever and 6.1% higher than May 2017. The International Air Transport Association reported US domestic passenger demand increased 5.3% year-on-year in April.
Backed by the expanding US petrochemical industry, LPG and ethane demand has been surging. Residual fuel oil, used in electric power generation, space heating, vessel bunkering and other industrial applications, declined compared to a year ago.
US oil production
US crude oil output continues to impress with activity ramping up in the shale patch. OGJ estimates that US crude oil production is rising to 10.7 million d/b this year, up from 9.4 million b/d in 2017 and 8.8 million b/d in 2016. Output of natural gas liquids from gas processing plants this year will reach 4.3 million b/d, thanks to the continued growth in marketed natural gas production.
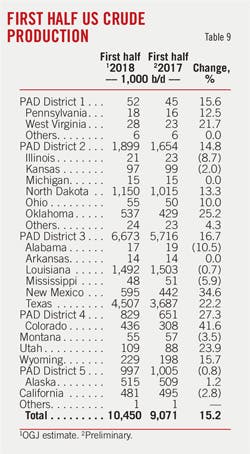
So far this year, US crude production, nearing 10.5 million b/d, stands 1.4 million b/d above the year-ago level, according to EIA data. Rig counts continue to recover from decreases that occurred during 2015 and 2016. Baker Hughes reported 863 working oil-directed rigs for the week ending June 22, up from 747 for this week last year.
Over half of the current US oil-directed rigs are in the Permian. Despite more complicated geological structure, the Permian is larger and has more potential for oil production than other regions. It is also distinguished by low breakeven and flexibility. Total production and production per new well have increased in the Permian for 11 consecutive years.
Wood Mackenzie expects the Permian will account for more than 80% of Lower 48 crude oil production growth year-on-year. Wolfcamp production alone is forecast to average 1.7 million b/d in 2018 and 2.3 million b/d in 2019.
According to an analysis of IHS Markit, production from the Permian is to reach 5.4 million b/d in 2023, more than current production from any single member of OPEC other than Saudi Arabia. This compares with 920,000 b/d in 2010. Nearly 41,000 new wells and $308 billion in upstream spending between 2018-23 will drive that growth.
Given robust Permian production, lags in infrastructure represent the greatest challenge. According to an estimate from IEA, even after considering planned upgrade of Permian Express 3 and BridgeTex later this year, the net gain in overall takeaway capacity for West Texas in 2018 is just 300,000 b/d, well short of anticipated production gains. Pressure on midstream infrastructure and pipeline capacity out of the Permian and Eagle Ford basins is unlikely to be resolved before second-half 2019. As a result, WTI Midland crude traded on average $10/bbl below prices in Cushing during May and forward prices are pointing to a discount as wide as $16/bbl during this year’s fourth quarter.
In addition, there are signs of rising costs in the shale patch, due to labor shortage, pressure pumps, road congestion, and water disposal constraints. According to a survey by the Federal Reserve Bank of Dallas, average break-even prices to profitably drill a new shale well has increased to $55/bbl for all regions from $47/bbl a year ago. The largest increase was reported for the “Other Permian” category.
As a few new projects coming online, Gulf of Mexico production is forecast to rise in both 2018 and 2019. These new projects include Shell’s Kaikias deepwater project, Chevron’s 75,000 b/d Big Foot project, Hess’s Stampede project, and others.
US NGL production has nearly doubled since 2010, outpacing the rate of natural gas production growth and setting an annual record of 3.7 million b/d in 2017. OGJ forecasts that US NGL production will reach 4.3 million b/d in 2018.
Specifically, ethane production growth contributed the most to the growth of US NGL production since last year, thanks to rising ethane demand and higher ethane prices. Two US ethane export terminals opened in 2016, and two US ethane-consuming petrochemical plants opened in 2017. Several more petrochemical plants are coming online in US in 2018 and 2019, further driving increases in ethane demand and prices. Ethane production will increase by 440,000 b/d over 2018 and 2019, accounting for 52% of the growth in NGPL production, according to EIA.
Refining
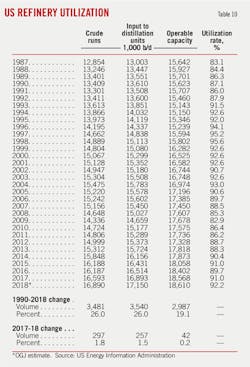
The US refiners have continued to run as hard as they could, spurred by lower product inventories, higher domestic demand, and surging exports. Year-to-date, refinery throughput was at the highest level on record. Over this year’s first 5 months, refinery distillation inputs averaged 16.9 million b/d compared with 16.68 million b/d over the same period a year ago. OGJ forecasts that refining capacity will average 18.6 million b/d this year, and utilization will be 92.2%, both higher than a year ago.
The refining margins have been uplifted by a wider-for-longer WTI Midland discount to WTI Cushing and a return of a Brent-WTI differential.
Although the Permian takeaway constraints serve as an upstream headwind, they are benefiting the inland US refiners. Since February, the Midland discount has steadily widened. As Permian production is expected to continue rising and takeaway capacity constraints are unlikely to be resolved in the short term, the WTI Midland discount will sustain and continue to benefit US refiners.
Also, according to an analysis from McKinsey Energy Insights, cash margins on the Gulf Coast show a diverging story between light and medium-heavy crude refining. Light crude margins into cracking capacity improved in the first quarter compared with the same quarter a year earlier, due to a widening of the Gulf Coast light crude discount to the international market. In contrast, margins for processing heavy and medium crudes in coking narrowed in the first quarter vs. last year’s conditions. This is in line with a general tightening of medium and heavy crude markets due to reduced supply. The big contributor to this has been lower output from the Middle East as OPEC has curtailed supply.
Meantime, logistics constraints to move marginal barrels of Western Canadian crude to market should continue to provide Midwest refiners with discounted heavy crude, though there is volatility in the discount.
According to Muse, Stancil & Co., refining cash margins so far in 2018 averaged $19.42/bbl for the Midwest, $16.91/bbl for the West Coast, $9.73/bbl for the Gulf Coast, and $2.98/bbl for the East Coast. In the same period in 2017, these refining margins were $9.52/bbl, $16.47/bbl, $9.04/bbl, and $3.53/bbl, respectively.
One concern of US refiners is the potential return of refining capacity in Mexico. In 2017, very low throughput due to major planned and unplanned outages of Mexican refineries helped provide a home for excess product on the Gulf Coast. In 2018, as Pemex restarted its 275,000 b/d Minatitlan and 190,000 b/d Madero refineries after major maintenance completed, product exports to Mexico may be negatively impacted.
Oil trade
Year-to-date through May, the US petroleum trade balance averaged 3.3 million b/d of net imports, which was the lowest level of net imports in more than 50 years. The expansion of US petroleum exports was supported by increasing US crude oil and product production, continued strong global demand growth, and a larger discount of WTI to Brent. Expansions of pipeline capacity and export infrastructure also facilitate US exports.
In 2017, US crude oil exports averaged 1.1 million b/d, up from less than 600,000 b/d in 2016. For the year, US exported crude oil to 36 destinations compared with 27 destinations in 2016 and 10 in 2015. In 2018, US crude oil exports have continued to hit record highs. US crude oil exports rose to 2.1 million b/d in this May, up by 1.1 million b/d from a year ago, according to API’s monthly statistics. More recently, the discount of WTI to Brent has widened again, fueling another export boom.
Canada remained the largest recipient of US crude oil exports in 2017, averaging 324,000 b/d. However, this was down from 359,000 b/d in 2016 and 427,000 b/d in 2015. Since US began exporting more crude oil to other countries, Canada’s share of total US crude oil exports decreased to 29% in 2017 from 61% in 2016.
Many Asian and European nations are among the largest destinations for US crude oil exports, as lighter crude produced in US shales is better suited for refinery fleets in Asia and Europe.
In 2017, with an average of 224,000 b/d of crude imports from US, China surpassed UK and Netherlands to become the second largest importer of US crude oil. US crude exports to China have been in the range of 300,000 b/d in this year’s first quarter, and the early indications are that the exports would be much higher in the second quarter. However, the imposition of crude tariffs by China will impact the US-China trade and adds a significant downside risk.
Other Asia, including South Korea, Japan, Singapore, Malaysia, and India, received 151,000 b/d of US crude oil in 2017, up from just 30,000 b/d in 2016. Major European destinations include the UK, the Netherlands, Italy, France, and Spain. Collectively, European countries received 290,000 b/d of US crude in 2017, up from 109,000 b/d a year ago.
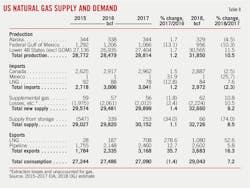
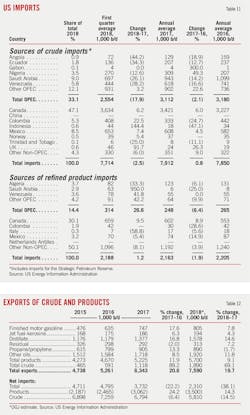
Despite a surge in crude exports, the volumes of US crude imports remain large, as most incremental growth in US oil production is to be exported, rather than displacing currently imported volumes. Crude imports averaged 7.92 million b/d in 2017, up from the 2016 average of 7.85 million b/d. In 2018, crude oil imports will fall 2.7% to 7.7 million b/d, according to OGJ.
During this year’s first quarter, the US imported 7.71 million b/d of crude oil, down from 8.12 million b/d over the same period a year ago. The leading source of US crude imports was still Canada, which supplied 3.63 million b/d, 47.1% of the total. US’s crude imports from Saudi Arabia for this year’s first quarter declined to 697,000 b/d from 1.28 million b/d for last year’s first quarter, and its first quarter crude imports from Venezuela dropped to 444,00 b/d from 694,000 b/d a year ago.
US refined product exports have increased steadily over the years. In 2018, OGJ forecasts US product exports to reach 5.7 million b/d, up from 5.2 million a year ago.
Distillate fuel was the most exported US petroleum product in 2017, averaging 1.4 million b/d of gross exports. US distillate exports went to 79 different destinations in 2017, particularly to markets in Mexico, Central America, South America, and Europe. OGJ forecasts that distillate fuel exports will reach 1.57 million b/d this year, up from 1.37 million b/d a year ago.
US exports of motor gasoline averaged a record high of 674,000 b/d in 2017, a 17.8% increase from the 2016 level. Mexico was the destination of more than half of total US gasoline exports.
In 2017, US exported 905,000 b/d of propane, with the largest volumes going to supply petrochemical feedstock demand in Asian countries. Overall, propane accounted for 17% of all US petroleum product exports in 2017.
US product imports remain supported by high product demand in the country. OGJ forecasts that US product import will increase marginally to 2.2 million b/d this year. As to the product supplier share, Canada and Russia maintained their position as first and second suppliers to the US. Algeria was the third largest product supplier to the US.
Combined, according to OGJ, US product net export will likely reach 3.5 million b/d this year, up from 3 million b/d a year ago.
US oil inventories
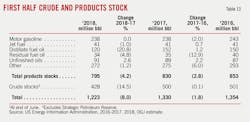
Total crude and refined product inventories so far this year were lower than the levels over the same period last year. At midyear, industry crude oil stocks stood at 428 million bbl, down from 518 million bbl at midyear 2017. The amount of crude oil in the Strategic Petroleum Reserve stood at 660 million bbl compared with 689 million bbl a year ago.
Total product stocks at midyear 2018 were 795 million bbl, down 4.2% from a year ago.
Although US gasoline product supplied, and gross exports together are estimated to be about 2% higher so far this year compared with 2017, US gasoline inventories have remained higher than their previous 5-year averages for most of 2018.
In contrast to gasoline inventories, US distillate inventories have fallen since January and were estimated to have fallen lower than the 5-year range as of May. Colder-than-normal weather lasted through April in parts of US, which led to higher heating oil consumption. Relatively high economic growth and rising oil and natural gas drilling activity also contributed to growing US diesel demand and lower diesel inventories.
About the Author
Conglin Xu
Managing Editor-Economics
Conglin Xu, Managing Editor-Economics, covers worldwide oil and gas market developments and macroeconomic factors, conducts analytical economic and financial research, generates estimates and forecasts, and compiles production and reserves statistics for Oil & Gas Journal. She joined OGJ in 2012 as Senior Economics Editor.
Xu holds a PhD in International Economics from the University of California at Santa Cruz. She was a Short-term Consultant at the World Bank and Summer Intern at the International Monetary Fund.
Laura Bell-Hammer
Statistics Editor
Laura Bell-Hammer is the Statistics Editor for Oil & Gas Journal, where she has led the publication’s global data coverage and analytical reporting for more than three decades. She previously served as OGJ’s Survey Editor and had contributed to Oil & Gas Financial Journal before publication ceased in 2017. Before joining OGJ, she developed her industry foundation at Vintage Petroleum in Tulsa. Laura is a graduate of Oklahoma State University with a Bachelor of Science in Business Administration.
