Refiners should consider Monte Carlo analysis to assess expansion projects
Due to robust growth in the global demand for refined products, refiners often face the tough decision of whether to spend significantly to accelerate expansion projects or stick to existing time frames. This is where a Monte Carlo analysis can frequently prove helpful. Using this analysis allows the refiner to compute thousands of scenarios to reflect the different variables and conditions that can affect an overall project schedule.
A Monte Carlo analysis calculates probability durations by representing estimated levels of uncertainty, demonstrating whether a project can be completed in a given time.
The fact that there is no way to guarantee that an expedited project will finish early complicates the refiner’s decision. This is mainly because traditional risk-assessment methods used to accelerate a project do not account for the full range of variables (weather, a shortage of resources, poor planning, and differing site conditions).
To illustrate a Monte Carlo analysis for a typical refinery project, we conducted one for a hypothetical project team trying to decide if it should expand a refinery to meet an expedited deadline. The analysis will help the team answer some basic questions that could dramatically affect the project. For example, does it make sense to accelerate the project or would it represent an unwarranted gamble? And what sort of savings might the project realize?
The Monte Carlo simulation applied uncertainty factors to the hypothetical project schedule and simulated how the project’s completion date would change given a certain confidence level. Despite the strength of a Monte Carlo simulation, sound professional judgment is still required. It is important, therefore, to increase the probability of an effective analysis by selecting the appropriate inputs.
The Monte Carlo simulation software that we used was Pertmaster Project Analytics. In December 2006, Pertmaster was acquired by Primavera Systems Inc.
Monte Carlo overview
Traditional approaches to evaluating project schedules include the critical-path method, program evaluation and review technique, and bar chart. Those approaches, which use single-point estimates, are limited in their ability to account for uncertainty.
In reality, numerous factors influence project schedules. These factors can include unrealistic timeline estimates, poor sequencing, insufficient resource availability, lack of vendor support, and scope growth.
The Monte Carlo technique of statistical sampling approximates solutions to quantitative problems. It randomly generates values for uncertain variables over and over, simulating a model and generating a most likely scenario.
For this test case, the refiner was interested in performing a risk assessment of its accelerated schedule for a major expansion project. We decided to use Monte Carlo simulation analysis to help the refiner assess whether the accelerated project schedule would meet the required completion date.
The first step in the analysis was assigning a probability distribution and uncertain variables to various activities in the schedule. Probability distribution types such as normal, triangular, uniform, or lognormal are chosen based on the conditions surrounding the uncertainty. Risk events and their effect on the planned schedule activities determine the probability factors.
Typically, one assigns a probability factor based on a risk event that has a slight risk of happening, a 50-50 chance, or is a near certainty. A 25% probability factor indicates that a risk event, such as slow productivity, could happen. A much higher probability factor indicates that a risk event, such as the complexity and lack of qualified people working on the planned activity, is nearly certain to happen.
In most cases for this analysis, we used a 25% probability factor. For example, if the original time for an activity was 10 days, its early completion time would be 8 days and its late completion time would be 13 days, due to rounding. The number must be rounded because the simulation software does not accept fractions for days.
Once the foreseeable risks for the activities are identified, the risk analysis should focus on the probability of those events or issues occurring. This is the uncertainty variable. A typical range may be 15-75% with a confidence level of 65-85.
In our model, we filtered activities that had been on the critical or near-critical path and applied a 15-75% (minimum and maximum occurrence) uncertainty variable. The uncertainty variable for each activity is based on a combination of historical data and the analyst’s professional judgment and experience.
This was a conservative approach given the types of risks identified along the critical path and near-critical path. We chose a 25% probability factor, however, because we felt that while the project management team had the necessary skills to complete the project early, we believed that lack of vendor cooperation and a labor shortage were risk factors of serious concern.
The Monte Carlo simulation can offer many insights. For instance, it can help with:
- Contingency scenarios. These can help the refiner set contingency values for contract milestones and evaluate the exposure to risk in the event that project delays cannot be absorbed by the contingency or overcome by project acceleration. These help the project manager decide to extend the contract’s duration, accelerate the project activities, or let the project schedule slip and become absorbed by the contingency or float.
- Tracking key activities. The simulation can help project management identify and track how critical-path activities may evolve due to deviations from the original plan. The analysis simulates activity outcomes using random numbers with allocated probabilities. Key activities having the greatest potential effect on the schedule can be identified and evaluated to determine their associated risk, and subsequently provide the project management team with a more accurate expected project completion date.
A Monte Carlo simulation is, however, no panacea. For example, an analysis based on activities not critical to the project’s completion will produce unrealistic simulation results. Also, poor judgment in selecting the probability distribution and uncertainty for a chosen event will lower the model’s accuracy.
Monte Carlo analysis
These are the basic elements of the test project we conducted:
- Main scope of work. The refinery project included construction of process units connected to centralized pipe racks; a product storage tank farm area and interconnecting pipe rack; an electrical substation and remote instrument enclosure; ancillary process and utilities piping; and electrical, civil, and instrumentation equipment.
Major work completed included engineering, procurement, construction, commissioning and start-up, civil, mechanical, electrical, and instrumentation and control work.
- Original baseline schedule. The design, procurement, and construction phases spanned 32 months, beginning in February 2006, and included process engineering, procurement of materials, and foundation excavation.
- An original planned completion date of Sept. 18, 2008.
- A proposed accelerated schedule of 30 months. As of Aug. 1, 2006, the project was 16.6% complete, with a project completion date forecast for July 15, 2008, about 2 months ahead of schedule.
- The owner asked: What is the level of risk associated with accelerating the original project schedule? Our recommendation was to assess the reasonableness of the baseline schedule, analyze the risk associated with the schedule reduction, and evaluate various scenarios generated by the Monte Carlo simulation model, including applying additional manpower to critical-path activities.
Probabilities, uncertainties
When conducting a Monte Carlo simulation, one must assign probability distribution and uncertainty variables to each activity. In this simulation run, we selected activities with a total float of less than 20 days and assigned a triangle distribution, and a minimum and maximum duration uncertainty variance of 25%.
A total float of less than 20 days summarized the more than 2,100 activities into a set of 220 to 300 activities that best described sequences that were critical, near-critical, and risk-sensitive to the project’s completion.
We selected a triangle distribution because it provided a range of possible outcomes given a low, high, and median occurrence of the risk event. Also, as previously mentioned, we selected the 25% uncertainty variable because issues with vendor cooperation and a labor shortage would probably affect the critical and near-critical activities.
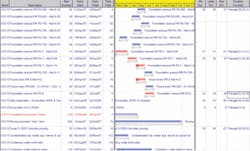
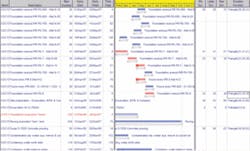
For example, Activity COC 1500, Foundation Execution, has a remaining duration of 41, minimum duration of 31, and maximum duration of 51 (Fig. 1). This means that it is most likely that work for Mat N-08 will be completed in 41 work days; however, there is a 25% chance that the activity will be completed 10 days faster or slower.
This simulation generated a snapshot of remaining duration, early finish, late finish, total float, probability distribution, and uncertainty variables for various activities (Fig. 1).
This analysis used the simulation’s histogram and probability distribution results to calculate and report a confidence level of when the project would be completed. We were willing to accept an 85% confidence level for the level of risk in this simulation run. Typically, the industry standard for a confidence level is 75-85%.
A confidence level greater than 85% would provide more certainty, but the same end results, in that the project would be completed after the accelerated project schedule date of July 15, 2008. A lower confidence level would yield less certainty and unrealistic results, which would be too optimistic for our analysis.
Results, recommendation
Overall, our model simulated, tabulated, and plotted the frequency and distribution functions for 1,000 simulated project schedule outcomes.
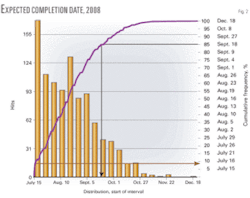
Before we ran the simulation model, the completion date for the accelerated project schedule was July 15, 2008. Our Monte Carlo simulation results, however, suggested that the project would have an 85% chance of completion by Sept. 18, 2008 (Fig. 2). July 15 was the best-case scenario, with a less than 10% probability. Worst-case scenario was Dec. 18, 2008.
Given these results, we concluded that the contractor would most likely be unable to complete the proposed accelerated schedule within 30 months. Paying the contractor an incentive or overtime premium to complete the project on or before July 15, 2008, would have not been cost beneficial to the owner.
In fact, we estimated that the owner would have paid the contractor $5-7.5 million in incentives and overtime premiums for a project completion date that only had a 10% chance of being completing within the projected 30 months.
Insights into improvements
Although an accelerated schedule would likely carry none of the originally hoped-for benefits, our simulations did identify key activities that the owner and project management team could focus on to improve schedule performance through applying overtime to selected areas.
In the Monte Carlo simulation software, two reports provided information on the sensitivities of uncertainty variables used in the simulation. They allowed us to identify high-risk activities likely to affect the project’s expected completion date:
Index, analysis
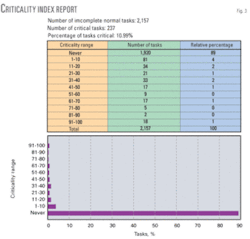
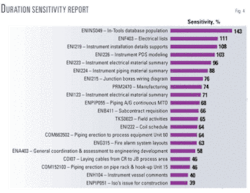
For this project, we used the criticality index and duration sensitivity analyses to identify areas for which risk can be evaluated and managed (Fig. 3). These results guided the project team in narrowing and prioritizing its focus by pinpointing those activities that appear on the critical or near-critical paths.
In this case, 237 out of 2,157 activities with a remaining duration appeared on the critical path or a near-critical path. The other 1,920 activities do not appear on the critical or near-critical path.
We adjusted the confidence limits and analyzed the sensitivities of the input variables relative to activity durations; for instance, we used a 75% instead of 85% confidence level and applied a 20% chance of uncertainty to an activity.
The duration sensitivity report displays only tasks as likely to affect the project schedule. Only instrumentation installation details, piping erection, instrumentation, and piping prefabrication units appeared on the critical path (Fig. 4).
This analysis allows the management team to focus its attention and risk management efforts on an even smaller grouping of work activities.
Benefits
The Monte Carlo analytical tool is well suited for capital infrastructure projects because it:
- Can help address uncertainties. It can readily account for the uncertainty that routinely affects large and complex construction projects.
- Is easy to refine. Refiners can use the results generated during simulation runs continually to refine the applied uncertainty variables and confidence levels to produce a more accurate model.
- Can help pinpoint higher risks. Refiners can use analyses such as criticality and duration sensitivity reports to identify and evaluate the high-risk activities likely to affect the project’s completion date.
- Can give a view of alternatives. Simulation runs can provide valuable information relative to the probability of completing a project by a certain date, thereby allowing management to make informed decisions regarding the application of labor, equipment, and financial resources.
For this refinery expansion, a Monte Carlo simulation indicated that the requested 2-month reduction in the overall project schedule was, in fact, not reasonably attainable and as such did not warrant the additional application of resources.
Results like these, however, certainly are not a sure bet. In fact, users of this tool must be cautious. To achieve the most reliable outcomes, the Monte Carlo simulation must be based on solid historical data and sound professional judgment that informs reasonable estimated activity durations, activity sequencing, and uncertainty risk factors.
Bibliography
- Murch, Matthew, Monte Carlo Simulation Presentation, Deloitte Financial Advisory Services, 2006.
- “Crystal Ball, Forecasting & Risk Analysis for Spreadsheet Users,” Decisioneering Magazine, 1996.
- Wendling, Robert V., and Lorance, Randal B., “Techniques for Developing Cost Risk Analysis Models,” 1999 AACE International Transactions Risk.02, 1999.
- Wendling, Robert V., and Lorance, Randal B., “Integration of Schedule and Cost Risk Models,” 1999 AACE International Transactions Risk.09, 1999.
- Clark, Dale, “Monte Carlo Analysis: Ten Years of Experience,” Cost Engineering, Vol. 43 (2001), No. 6, pp. 40-45.
- Kandaswamy, S., “The Basics of Monte Carlo Simulation: A Tutorial,” Proceedings of the Project Management Institute Annual Seminars & Symposium, New Jersey, Nov. 1-10, 2001.
- Noor, Iqbal, and Tichacek, Robert L., “Contingency Misuse and Other Risk Management Pitfalls,” 2004 AACE International Transactions Risk.04, 2004.
- Caddell, Christopher P., Crepinsek, Sherri R., and Klanac, Gerald, “Risk Assessments: Value of the Process,” 2004 AACE International Transactions Risk.01, 2004.
- “Monte Carlo Method,” www.riskglossary.com, 2006.
The author
John Stone ([email protected]) is a manager in the construction advisory services group of Deloitte Financial Advisory Services LLP, Philadelphia. He has 16 years’ experience in project cost assessment and process assessments, project controls, change order analysis, construction field experience, and construction disputes. Stone has been involved in power plant, commercial, transportation, resorts, and educational projects. He holds a BS in civil and construction engineering from Temple University, Philadelphia, and an MSEng from Drexel University, Philadelphia.
