US olefins industry enters new era
Dan Lippe
Petral Consulting Co.
Houston
First-half 2018 was simultaneously the best of times and the worst of times for the US petrochemical industry: the best of times for those chemical companies who successfully and smoothly started up new ethylene capacity that had been under construction for 3+ years and for those who took advantage of the very rare opportunity to accumulate ethylene inventory at bargain-basement prices.
For some ethylene producers, however, first-half 2018 was also the worst of times, as gross profit margins in the US Gulf Coast (USGC) ethylene spot market dropped to their lowest levels in 25 years during the second-quarter. Until all new polyethylene plants—the primary outlet for increasing ethylene production in the USGC—start up and reach full operating rates, the USGC ethylene market will continue to struggle with surplus supply that emerged in second-quarter 2018.
New plant startups
The second of several recently proposed new petrochemical plants entered service in March 2018, when ChevronPhillips Chemical Co. LP commissioned its 3.3-billion lb/year ethane cracker at Cedar Bayou, Tex., and began producing purity ethylene in April (OGJ Online, Mar. 12, 2018). A few months later, ExxonMobil Chemical Corp. started up its new 3.3-billion lb/year ethane steam cracker at the company’s integrated chemical and refining complex in Baytown, Tex. (OGJ Online, July 26, 2018).
During second-half 2018, Shintech Inc. and Indorama Ventures Olefins LLC are scheduled to start up new plants in Louisiana.
Formosa Petrochemical Corp.’s petrochemical expansion in Point Comfort, Tex., is reportedly scheduled to reach mechanical completion by yearend 2018 for planned startup sometime during first-half 2019.
Ethylene production
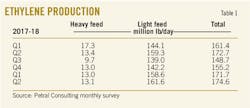
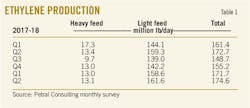
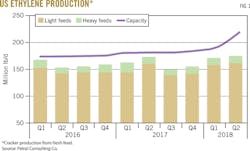
Petral Consulting Co. tracks US ethylene production via a monthly survey of operating rates and feed slates. Results of the monthly survey showed ethylene production was 150-160 million lb/day in 2015-16. Production in fourth-quarter 2017 was also in this range before increasing to 171 million lb/day in first-quarter 2018 and 175 million lb/day in second-quarter 2018.
Petral Consulting estimates industry nameplate capacity in operation during first-quarter 2018 was 69 billion lb/year and increased to 72.3 billion lb in second-quarter 2018. Operating rates were 90.7% in first-quarter 2018 but dipped to 85.6% in the second quarter. Production and operating rates indicate the industry experienced “the better of times” in first-quarter 2018. With rising production during second-quarter 2018 growing slower than the increase in production capacity, the drop in operating rates was one indication the industry’s experience during the second quarter did not reflect “the better of times” (Table 1).
Production from Texas plants averaged 120 million lb/day in first-quarter 2018 and 128 million lb/day in the second quarter. Operating rates for Texas plants were 89.1% in the first quarter before slipping to 85.5% during the following quarter. By the end of first-quarter 2018, operable capacity in Texas was 48.9 billion lb/year, which increased to 52.2 billion lb/year by the end of second-quarter 2018. Production from Louisiana plants averaged 44.2 million lb/day in first-quarter 2018 and dipped to 39.4 million lb/day during the second quarter, while first-quarter operating rates for Louisiana plants were 93.5% before decreasing to 83.5% in the second quarter.
Based on monthly survey results and reports published by PetroChem Wire, Petral Consulting notes that, in response to the sharp decline in spot prices for ethylene in Texas and Louisiana trading hubs, four ethylene producers reduced operating rates or took five different plants out of service for at least 30 days in second-quarter 2018. These five plants have a combined nameplate capacity of 7.25 billion lb/year. Petral Consulting estimates production curtailments in second-quarter 2018 were 1 billion lb.
Fig. 1 shows trends in ethylene production.
Ethylene production costs
Ethylene production costs are determined by raw material costs and coproduct credits. Based on variations in yield patterns for the various feeds, coproduct volumes vary widely between the three categories of plants (ethane-only, LPG-only, and multifeed plants). Raw material costs are determined by each feedstock’s price and its conversion to ethylene. Similarly, coproduct credits are determined by spot prices and production volumes for each coproduct but only for those plants that upgrade all coproduct streams to meet purity specifications.
A few ethylene plants can upgrade all coproducts to purity streams and sell all coproducts at market prices. Some ethylene plants produce purity coproduct propylene but produce all other coproducts as mixtures (mixed butylene-butadiene and mixed aromatics) and sell mixtures at discounted prices. Variations in realized revenue for coproducts result in large differences in coproduct credits from one plant to another. Cash production costs are determined by simple addition of raw material costs and coproduct credits (see accompanying box).
US ethylene producers continued to increase ethane as their feedstock of choice. In first-half 2018, ethylene produced from ethane was almost 80% of total production vs. about 75% in second-half 2017. Ethylene produced from normal butane accounted for 4.5-5.0% in first-half 2018. The steady increase in ethylene production from plentiful ethane supplies helped US ethylene producers fulfill their expectations of “the best of times.” Production costs based on purity ethane were 12-13¢/lb in first-half 2018. For the remaining 17-19% of US ethylene production, however, cash production costs were 23-24¢/lb. US ethylene production costs—80-85% based on ethane and normal butane—were measurably lower than production costs in Asia and Europe.
As crude oil prices in domestic and international markets moved steadily higher in first-half 2018, prices for heavy feedstocks in the USGC also increased consistently. The price of West Texas Intermediate (WTI) crude was $63/bbl in first-quarter 2018 (up $7.50/bbl from fourth-quarter 2017) and increased to $68/bbl in the second quarter. Prices for heavy feedstocks closely tracked rising crude oil prices. Spot prices for natural gasoline in first-quarter 2018 averaged 141¢/gal, up 7.3% from fourth-quarter 2017. Spot prices for natural gasoline (and light, straight-run naphtha of similar quality) increased to 154¢/gal in second-quarter 2018, up 9% from the previous quarter.
Daily price reports from PetroChem Wire show spot prices for polymer-grade propylene briefly spiked to 67¢/lb in mid-January but settled into a range of 45-50¢/lb in February-May, nearly unchanged from fourth-quarter 2017. Prices spiked again in late May and early June but dropped to 55-57¢/lb for most of June. First and second quarterly averages for polymer-grade propylene were 50.8¢/lb and 51.3¢/lb, respectively.
Spot prices for benzene were 325-335¢/gal in November and December 2017 but dipped to 310-315¢/gal in January before declining slowly for the balance of first-half 2018. Since coproduct credits did not keep pace with rising prices for light naphtha, natural gasoline, and gas oil, cash production costs bore the full brunt of higher feedstock prices in first-half 2018.
Production costs for natural gasoline and light, straight-run naphtha of similar quality were 23-27¢/lb in first-quarter 2018 before jumping to 26-37¢/lb in the second quarter. Production costs for light naphtha feeds were 14-18¢/lb higher than production costs for purity ethane in the first quarter and 17-27¢/lb more in the second quarter.
First-quarter 2018 propane prices in Mont Belvieu, Tex., confounded expectations based on the year-over-year drop of almost 30 million bbl for propane inventory in reportable USGC storage. After running up to a prewinter high of 98¢/gal in November 2017, propane prices fell to 90¢/gal in January and 75-80¢/gal in March. Ethylene production costs based on propane were 19-22¢/lb in first-half 2018. Propane was less expensive than heavy feed but remained much more expensive than ethane and normal butane.
Monthly survey results showed ethylene producers reacted true to form and reduced propane consumption rates to 230,000-255,000 b/d in November-December 2017 from 340,000-355,000 b/d in April-June 2017. Demand for propane remained weak in first and second-quarter 2018 and was about 16 million bbl less than historical levels.
In February-April 2018, propane prices fell to 75-85¢/gal. Production costs based on propane for all of first-half 2018 were again less than for light naphtha feeds, and feedstock demand recovered.
Table 2 shows production costs for major ethylene feedstock.
Ethylene pricing, profit margins
Spot prices for ethylene generally fluctuate within a range defined by cash costs for the higher-cost feedstock. The low end of the range is determined by the cash cost for high-cost feedstock with margins in a range of -5¢/lb to +5¢/lb. The high end of the range is determined by cash costs plus margins of 10-15¢lb. Occasionally, a buying void in one or more USGC trading hubs triggers a collapse in spot prices; second-quarter 2018 was just such a situation.
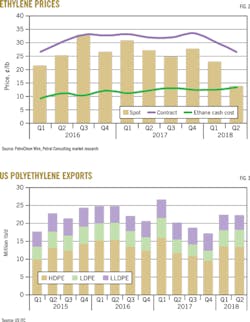
Spot ethylene prices began 2018 at parity with fourth-quarter 2017 prices, averaging 27.6¢/lb, according to PetroChem Wire. Spot prices were 5.1¢/lb below net transaction prices (NTP) for January, and discounts were consistent with the average of 5.7¢/lb in fourth-quarter 2017. Spot ethylene prices at Nova Chemicals Corp.’s hub in Mont Belvieu began falling in February, and the decline accelerated in March-April. Spot prices at the Nova Chemical hub were 23.1¢/lb in first-quarter 2018 but collapsed to 14.0¢/lb in the second quarter.
Margins for high-cost feeds were -5¢/lb in first-quarter 2018 and spiraled down to -18.0¢/lb in the second quarter. Margins based on spot ethylene prices and cash costs for light naphtha feeds based on discounted coproduct prices were -25¢/lb to -33¢/lb in second-quarter 2018, while margins based on propane feed were -9¢/lb to -16¢/lb. Margins for purity ethane also fell below zero in June.
Petral Consulting explains the collapse in spot prices and abnormally weak margins as the result of a sharp drop in activity by major ethylene buyers and a large increase in surplus ethylene volumes made available for sale in the spot market at any price. Spot prices will rebound, most likely, when new polyethylene plants come on stream and the volume of ethylene flowing into the spot markets declines sharply.
Based strictly on the collapse in spot ethylene prices and margins, second-quarter 2018 was a disaster of epic proportions that will define “the worst of times” for some ethylene producers for years to come. Was second-quarter 2018, however, as bad as price and margin trends suggest?
Most ethylene produced in the USGC is consumed internally by vertically integrated producers, and internal transfer prices are based on NTP or some combination of NTP and spot prices. According to PetroChem Wire reports, the volume of fixed-price trades in Texas and Louisiana fell sharply in second-quarter 2018. The combined volumes of all fixed-price trades (current month only) for all trading locations were 5.66 million lb/day in first-quarter 2018 but fell to 3.09 million lb/day in the second quarter. Fixed-price trades for the current month were 4% of monthly production in first-quarter 2018 but were only 2.55% in the second quarter. The average for the previous eight quarters was 4.59%. Fixed-price trades in second-quarter 2018 were 44% less than the average for the previous eight quarters.
Based on NTP pricing and margins, second-quarter 2018 was not “the worst of times.” Ethylene producers settled NTP prices at 32.75¢/lb in January and reduced NTP prices to 29.75¢/lb in February and 28.25¢/lb in March. In second-quarter 2018, NTP settled at 26.0-26.75¢/lb. Cash production costs based on ethane and normal butane (accounting for 80-85% of all ethylene production in first-half 2018) were 11-13¢/lb. Gross margins in first-quarter 2018 were 17.9¢/lb for ethane and 23.1¢/lb for normal butane. Gross margins in second quarter were 13.1¢/lb for ethane and 17.8¢/lb for normal butane.
Fig. 2 shows historical trends in ethylene spot prices and NTPs.
Olefin-plant feed slate trends
Petral Consulting’s monthly survey of plant operating rates and feed slates showed industry demand for NGL feedstocks jumped to 1.73 million b/d in first-quarter 2018 and 1.74 million b/d in the second quarter. Demand for NGL feeds in first-half 2018 was 209,000 b/d (13.7%) more than in second-half 2017. Full recovery from hurricane-related downtime was the primary factor for the increase in demand in the first quarter. In second-quarter 2018, voluntary plant shutdowns in response to the collapse in spot ethylene prices offset increased production from new capacity (Table 3).
Ethane demand was 1.34 million b/d in first-half 2018, up 195,000 b/d from second-half 2017. Ethane’s share of fresh feed was 73.1% in first-half 2018 vs. 70.2% in second-half 2017. In Texas, ethane’s share of fresh feed was 71.6% in first-half 2018 vs. 67.0% in second-half 2017. In Louisiana, ethane’s share of fresh feed was also 71.6% in first-half 2018 vs. 69.7% in second-half 2017.
Propane demand was 263,000 b/d in first-half 2018, barely 7,400 b/d more than in second-half 2017. Propane’s share of fresh feed was weaker in first-half 2018, averaging 14.3%. Demand for heavy feeds (natural gasoline, naphtha, condensate, and gas oil) was 148,000 b/d in first-half 2018, or 8,000 b/d less from second-half 2017.
Monomer exports
The most important markets for ethylene and propylene are as raw material feeds for production of polyethylene and polypropylene. Historically, US chemical companies focused almost exclusively on finding export markets for polyethylene, ethylene glycol, PVC, polypropylene, and acrylonitrile. The emphasis on derivatives exports led to minimal USGC exports of ethylene and propylene monomer. Export terminal capacity for monomers was very limited, while transportation costs were viewed as prohibitive.
Chemical companies may remain reluctant to make capital investments in export-terminal capacity for ethylene and propylene monomer, but major midstream companies don’t share this reluctance. Enterprise Products Partners LP (EPP) and Sunoco Logistics Partners LP developed cryogenic waterborne-ethane export terminals to take advantage of substantial and persistent ethane supply surpluses. Both companies are evaluating the feasibility for ethylene export terminals in the USGC. Until then, however, ethylene exports are limited by the capacity of the existing terminal.
US International Trade Commission (ITC) data showed ethylene monomer exports averaged 1.18 million lb/day in January-May 2018. Exports in first-half 2018 were 0.41 million lb/day (54%) more than in second-half 2017. The variability in exports in 2017 through first-half 2018 is consistent with historic and large variability.
Polyethylene exports
According to US ITC statistics, US exports of polyethylene—including high-density polyethylene (HDPE), low-density polyethylene (LDPE), and linear low-density polyethylene (LLDPE)—rebounded in January-May 2018 to 22.9 million lb/day, up 4.45 million lb/day (24%) from second-half 2017. Exports to Canada and Mexico were 0.7 million lb/day, or 7.9% more vs. second-half 2017. Exports to all other destinations (rest of world, ROW) were 3.75 million lb/day, or 39.1% higher from second-half 2017 (Fig. 3).
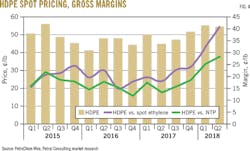
Equally important, spot prices for HDPE (free on board, FOB, Houston) were steady at 55¢/lb in first-half 2018 vs. 48-52¢/lb in second-half 2017. The strong increase is a harbinger of continued and sustained growth in polyethylene exports as new capacity comes on stream during the next 6-12 months. The increase in exports to ROW destinations, and the increase in polyethylene spot prices are indicators that second-half 2018 and 2019 may be “the best of times” after all (Fig. 4).
Propylene supply
Olefin-plant coproduct supply. Coproduct propylene supply depends primarily on the use of propane, normal butane, naphtha, and other heavy feeds. In first-half 2018, the monthly survey showed demand for LPG feeds (propane and normal butane) was 347,700 b/d, down 18,500 b/d (5.5%) from second-half 2017. Demand for heavy feeds, however, was 8,200 b/d (5.3%) less than second-half 2017. Demand for LPG and heavy feeds was 495,700 b/d, up 9,900 b/d from second-half 2017.
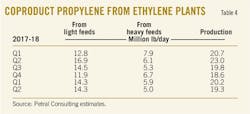
Coproduct supply was 19.8 million lb/day in first-half 2018, up 0.6 million lb/day (3.3%) from second-half 2017. Coproduct supplies from light feeds (ethane, propane, and normal butane) during first-half 2018 were 14.3 million lb/day, up 1.0 million lb/day (8.1%) from second-half 2017, while coproduct supply from heavy feeds was 5.6 million lb/day, or 0.4 million lb/day (7.4%) lower vs. second-half 2017 (Table 4).
PDH plant supply. Based on PetroChem Wire’s daily reports, Petral Consulting estimates propylene production from propane dehydrogenation (PDH) plants at the USGC. Two plants with a combined capacity of 8.4 million lb/day were operational in first-quarter 2018, with production averaging 6.4 million lb/day (76% of nameplate capacity).
EPP started up its 1.65-billion lb/year Mont Belvieu PDH plant in second-quarter 2018, increasing operable USGC capacity to 13.0 million lb/day. Production in second-quarter 2018 was 10.1 million lb/day (78% of nameplate capacity).
Refinery supply. Refinery propylene sales into the merchant market are a function of:
• Fluid catalytic cracking unit (FCCU) feed rates (most important variable).
• FCCU operating severity (important but not directly measurable).
• Economic incentive to sell propylene rather than use it as alkylate feed.
Variations in FCCU feed rates generally are the most important parameter determining refinery-grade propylene supply. Economic factors that may result in changes in operating severity are generally of secondary importance.
Statistics from the US Energy Information Administration (EIA) show US refineries operated FCCUs at 4.81 million b/d in first-quarter 2018, a decrease of 249,000 b/d (4.9%) from fourth-quarter 2017. Based on EIA monthly statistics for April 2018 and weekly statistics for May-June, Petral Consulting estimates FCCU feed rates in second-quarter 2018 increased to 5.1 million b/d, up 327,000 b/d (6.8%) from the first quarter.
Regionally, EIA statistics showed feed rates for FCCUs in the USGC and Midcontinent were 3.62 million b/d in first-quarter 2018. Petral Consulting estimates feed rates were 3.8 million b/d in the second quarter, with overall first-half 2018 feed rates only about 45,000 b/d (1.3%) higher vs. second-half 2017.
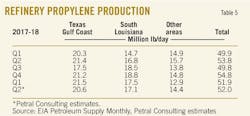
Refinery-grade propylene supply from USGC and Midcontinent refineries was 48.9 million lb/day in first-quarter 2018 and 48.2-48.5 million lb/day in the second quarter. USGC merchant sales—which includes all supply from USGC and Midcontinent refineries—in first-quarter 2018 were down 1.80 million lb/day (3.5%) from fourth-quarter 2017. Petral Consulting estimates merchant sales for first-half 2018 will be 2 million lb/day less than in fourth-quarter 2017 (Table 5).
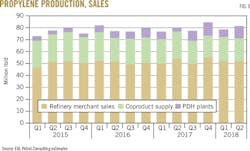
US production. EIA statistics for refinery-grade propylene and Petral Consulting estimates for coproduct supply and PDH plant production show total US propylene supply was 69 million lb/day in third-quarter 2017 before increasing to 75 million lb/day in the fourth quarter. Supply from all sources fell to 71 million lb/day in first-quarter 2018 amid declining PDH production. Petral Consulting estimates production in second-quarter 2018 was 74 million lb/day. While coproduct supply was down about 0.5 million lb/day from the first quarter, PDH plants produced almost 4 million lb/day more during the second quarter.
Fig. 5 shows trends in coproduct supply, PDH plant production, and refinery merchant sales of propylene.
Propylene economics, pricing
USGC propylene markets, until 2010, were dominated by a close-knit fraternity of buyers and consumers. In 2010, production from PDH plants added a new dimension of supply and pricing variability. PetroLogistics LLC introduced this new dynamic element by starting up North America’s first PDH plant at the Houston Ship Channel in late 2010. In 2016 and 2018, Dow Chemical Co. and EPP launched PDH plants at Freeport, Tex., and Mont Belvieu, respectively.
Petral’s ongoing analysis of variations in propylene pricing and pricing relationships provided strong support for the view that refinery-grade propylene prices tracked trends in unleaded regular gasoline prices during 2005 through first-half 2012. During this 30-quarter period, refinery-grade propylene prices were never discounted vs. unleaded regular gasoline prices. Premiums were 10¢/lb or more for 20 quarters (66.7%), more than 5¢/lb but less than 10¢/lb in 6 quarters (20%), and less than 5¢/lb in only 4 quarters (13.3%).
From 2012 through second-quarter 2018 (26 quarters), the distribution of differentials was much wider. Prices for refinery-grade propylene were discounted in 6 quarters (23%), zero to 4.99¢/lb in 6 quarters (23%), 5.00-9.99¢/lb in 5 quarters (19.2%), and 10¢/lb or more in 9 quarters (34.6%). In 2005-11, premiums averaged 13.4¢/lb. In 2012 through first-half 2018, differentials (premiums and discounts) were 6.6¢/lb. In the last 10 quarters, differentials were only 2.85¢/lb.
Premiums of less than 10¢/lb in 2005-11 were indications of weak prices. Premiums of 5¢/lb or more in 2016 through first-half 2018 are indications of strong prices.
The summary of price differentials between refinery-grade propylene and unleaded regular gasoline supports Petral Consulting’s assessment that PDH plants increased pricing variability for refinery-grade propylene prices. As each PDH plant reached a sustained operating rate of 85%, the need for refinery-grade propylene upgraded to polymer-grade propylene via propane-propylene splitters declined.
At 85% of nameplate capacity, PDH plants will contribute 11 million lb/day to the USGC polymer-grade propylene market. In the absence of any offsetting reduction in refinery-grade propylene supply, polymer-grade propylene markets in the USGC would trend toward a chronically surplus supply balance.
Propylene exports, historically, were just enough to offset imports from Canada. Exports averaged 0.85 million lb/day in 2010 through first-quarter 2015. In the past 12 quarters (second-half 2015 through first-half 2018), however, propylene exports were 2.5 million lb/day (about three times more than in 2010 through first-quarter 2015) and were never less than 1.9 million lb/day in the last 8 quarters.
Before PDH plants became a major supply source, Petral Consulting based price forecasts on trends in refinery-grade propylene prices and modest premiums for polymer-grade propylene vs. refinery-grade propylene. Premiums for polymer-grade propylene spot prices vs. refinery-grade propylene were 3-4¢/lb in 2005-09 with occasional divergence above or below this level.
Premiums for polymer-grade propylene exceeded 10¢/lb for the first time in second-quarter 2010 but fell below 10¢/lb in fourth-quarter 2010 through third-quarter 2011. In the next 4 years (2012-15), polymer-grade premiums were within a range of 7-12¢/lb, averaging 10.1¢/lb. Since 2015, premiums have never averaged less than 10¢/lb in any quarter and were 18.2¢/lb in first-quarter 2018. Premiums are now routinely 10-12¢/lb and are three to four times more than in 2005-09.
In the current market, unpredictable variations in supply-demand balances result in large swings in polymer-grade propylene pricing and differentials. The unpredictable variability of the USGC’s three PDH plants now results in major and unexpected swings in buying activity and greater pricing volatility.
Pricing volatility (measured as the standard deviation of day-to-day variation in spot prices for each month) increased as propylene supply from PDH plants and the number of PDH plants in operations increased. In 2017, the standard deviation for day-to-day variation in spot prices averaged 0.62¢/lb and was 1.0¢/lb or more in only 1 month. In first-half 2018, the standard deviation averaged 1.09¢/lb and was 1.0¢/lb or more in 3 months. As the third PDH plant settles into extended periods of sustained, steady operations, the impact of PDH plants on pricing volatility is likely to decline, as price volatility primarily results from unanticipated swings in supply from PDH plants. As EPP’s PDH plant reaches operating stability, supply variability will be reduced, and pricing volatility should decline.
Even though most propylene exports continued to move to Columbia and Mexico, the sustained higher volume of propylene exports allowed USGC producers and marketers to avoid the price-depressing impact of periods of surplus inventory.
Propylene, polypropylene exports
After monomer exports reached a record high of 3.87 million lb/day in third-quarter 2017, exports fell to 1.85 million lb/day in fourth-quarter 2017. The lingering impact of Hurricane Harvey limited coproduct and refinery-grade propylene supply; but output from PDH plants rebounded, and USGC refinery-grade propylene supply also increased in fourth-quarter 2017.
The supply recovery in fourth-quarter 2017 was strong enough to support a robust rebound in exports in first-half 2018. US ITC statistics show monomer exports were 3.04 million lb/day in first-quarter 2018 and 2.90-2.95 million lb/day in the second quarter.
US ITC statistics also show US polypropylene exports were weak in second-half 2017 and remained weak in first-half 2018. Some of the weakness in polypropylene exports in fourth-quarter 2017 can be attributed to Harvey-related problems. Exports in first-quarter 2018, however, remained weak at 5.82 million lb/day.
Polypropylene exports staged a modest recovery in April 2018, averaging 6.27 million lb/day in April-May. From second-quarter 2017 through first-quarter 2018, polypropylene exports were 6.09 million lb/day, or 3.1 million lb/day (34%) less than in second-half 2016 through first-quarter 2017.
Second-half 2018, first-half 2019
The tale of two futures for the US olefins industry undeniably began in first-quarter 2018, but the outlook for second-half 2018 and first-half 2019 is less uncertain than it was 6 months ago. After declining for 3 consecutive quarters, polyethylene exports to ROW destinations increased by 49.8% in first-quarter 2018 vs. fourth-quarter 2017. Exports to ROW destinations in first-quarter 2018 were also 5.5% more than in 2016 but remained below the record high of 17.23 million lb/day in first-quarter 2017. The increases in first and second-quarters 2018 supported higher prices. According to PetroChem Wire, spot prices for HDPE were 50-53¢/lb in fourth-quarter 2017 but increased to 55-58¢/lb for first-half 2018.
The surge in ethylene production without the benefit of any offsetting rising polyethylene production resulted in a collapse in spot ethylene prices in all USGC pricing hubs. In second-half 2018, hope for a recovery is based on startup of several new polyethylene plants.
Petral Consulting expects 4 billion lb/year of additional capacity will start up in second-half 2018. The belated startup of various polyethylene plants in second-half 2018 may be sufficient to fully offset new ethylene capacity for all of 2018. The accumulation of low-cost ethylene in inventory in first-half 2018, however, will continue to undermine bullish considerations.
The outlook for first-half 2019 is similar to first-half 2018. Two new Louisiana ethylene plants from Indorama and Shintech are likely to reach full rates. Initially, neither plant will be supported by additional derivatives capacity. With an additional 2 billion lb/year of ethylene capacity, Louisiana’s shortfall will decline by 40-50%, likely sparking another major collapse in spot ethylene prices.
After 2019, ethylene producers will work through “the worst of times” with help from the midstream. At least one and probably two dedicated ethylene export terminals will be in service by late 2020. When USGC ethylene producers have three export terminals, the periodic episodes of extended periods of surplus ethylene supplies and collapsing spot prices will become fading memories.
The author
Daniel L. Lippe ([email protected]) is president of Petral Consulting Co., which he founded in 1988. He has expertise in economic analysis of a broad spectrum of petroleum products including crude oil and refined products, natural gas, natural gas liquids, other ethylene feedstocks, and primary petrochemicals.
Lippe began his professional career in 1974 with Diamond Shamrock Chemical Co., moved into professional consulting in 1979, and has served petroleum, midstream, and petrochemical industry clients since. He holds a BS (1974) in chemical engineering from Texas A&M University and an MBA (1981) from Houston Baptist University. He is an active member of the Gas Processors Suppliers Association.
Feedstock prices, coproduct values, and ethylene plant yields determine ethylene production costs. Petral Consulting maintains direct contact with the olefin industry and tracks historic trends in spot prices for ethylene and propylene. We use a variety of sources to track trends in feedstock prices.
Some ethylene plants have the necessary process units to convert all coproducts to purity streams. Some ethylene plants, however, do not have the capability to upgrade mixed or crude streams of various coproducts and sell some or all their coproducts at discounted prices. We evaluate ethylene production costs in this article based on all coproducts valued at spot prices.
